Aero–acoustics in constricted pipe flow at low mach number
Hansen A Mansy,1
Regret for the inconvenience: we are taking measures to prevent fraudulent form submissions by extractors and page crawlers. Please type the correct Captcha word to see email ID.

Peshala T Gamage,2 Fardin Khalili1
1Biomedical Acoustics Research Laboratory, University of Central Florida, USA
2Department of Mechanical Engineering, Embry-Riddle Aeronautical University, USA
Correspondence: Hansen A Mansy, Biomedical Acoustics Research Laboratory, University of Central Florida, 4000 Central Florida Blvd, Orlando, FL 32816, USA
Received: September 29, 2018 | Published: October 15, 2018
Citation: Gamage PT, Khalili F, Mansy HA. Aero–acoustics in constricted pipe flow at low mach number. J Appl Biotechnol Bioeng. 2018;5(5):306-309.
DOI: 10.15406/jabb.2018.05.00155
Download PDF
In this study, the sound generation in a constricted pipe at low Mach number (M=0.003, Re=1170 at the inlet) flow is investigated using a hybrid modeling approach of computational aero-acoustics (CAA). Large Eddy Simulation (LES) model is used simulate the flow and accurately capture the flow instabilities associated with the constriction. The Acoustic Perturbation Equation (APE) method is used to model the acoustic field where the source terms are derived from the incompressible flow simulation results. The acoustic spectra from the APE simulation results showed good agreement (within 9%) with measured values on the pipe wall downstream of the constriction. The strongest APE acoustic sources were found to occur in the jet core breakdown region that contained the highest pressure fluctuations in the flow field. Proper Orthogonal Decomposition (POD) was used to study the Coherent flow structures in the jet core breakdown region in order to further understand the characteristics of acoustic sources. The strongest structure corresponds to the peak frequency of the measured sound pressure spectra. The study results improve our understanding of the sound generation mechanisms in biomedical applications involving the airways such as phonation and partial airway obstruction.
Keywords: acoustics measurements, computational aero-acoustics, proper orthogonal decomposition, biomedical application
Computational Aero-acoustics (CAA) modelling of flow generated sound in low Mach number internal flow can be useful for investigating certain physiological phenomena such as arterial murmurs, phonation and partial airway obstruction such as stridor.1–3 In these applications, accurate modelling of the acoustic field will help understand the sound generating mechanisms, which improve diagnose medical conditions. However, modelling the acoustics field in such applications can be challenging due to their confined geometry (internal flow) which leads to acoustic reflections and near-field acoustic modelling (i.e., when computational domain is smaller than acoustic wave lengths). These challenges prohibit the use of widely used CAA methods such as FW-H and Lighthill’s analogy which are more suited to model the acoustic field in far-field and free space (with no reflections).4,5 Application of direct methods to model the acoustic field through solving compressible Navier-Stokes equations is computationally expensive since they require a very low time step due to the length scale differences between the acoustic and flow domains.6 In addition, extra computational effort is needed to maintain the numerical errors in the direct simulations to be much smaller than the acoustic variables, which are very small for low Mach numbers (M). These variables are estimated to be in the order of M3 - M4.6,7
This study employs a hybrid CAA approach where the acoustic field is modelled in parallel with an incompressible flow simulation. This method was introduced by R. Ewert and W. Schroder who developed a system of acoustic perturbation equations (APEs) to simulate the acoustic field using the results from computational fluid dynamics (CFD) simulations.5 In the current study, the flow field is simulated using large eddy simulation (LES) model to accurately capture the flow instabilities caused by the constriction. These CFD simulation results were validated by comparing with the velocity measurements using laser doppler anemometry (LDA). The detailed description of the CFD simulation and the experimental measurements can be found in previous studies.7–9 CAA simulation results were validated by comparing the simulated sound pressure spectra with measured sound pressure spectra at different points on the pipe wall. Furthermore, CAA simulation results were analyzed to study the acoustic sources and acoustic propagation in the pipe.
Model geometry
Figure 1 shows a cross-section of the pipe with its dimensions. This geometry is selected due to its simplicity and to represent physiological phenomena such as phonation and airway stridor. The diameter of the constricted area forms an area reduction of 75%.

Figure 1 Cross-section of the model geometry.
Computational modelling
Computational fluid dynamics (CFD) simulation: Accurate modelling of flow is required as the acoustic source term for CAA simulation is calculated from the flow simulation results. Here, the flow simulation should be able to resolve the eddies in the flow separation regions where the acoustic source terms are generally expected to be. To achieve high accuracy, Large Eddy Simulation (LES) model was employed in the current study. After a grid independence study, a mesh consisting of ~2 million cells was used in the simulation. This mesh was refined near the constriction where high instabilities are expected, and a boundary layer mesh was added to the wall to maintain Y+ value less than 1. The flow field was considered to be incompressible due to its low Mach number (maximum M~0.01). Uniform inlet velocity boundary condition (Re=1170) was used while zero static pressure and non-slip boundary conditions were employed at the outlet and wall, respectively. LES simulation results were validated by comparing computational results with Laser Doppler Anemometry (LDA) velocity measurements along the pipe centerline. Detailed description of the mesh, CFD model and validation against LDA measurements can be found in previous studies.7–9 A time step of 0.0001 seconds was used in the simulations. The density and the dynamic viscosity of the air were selected as 1.184 kgm-3 and 1.855×10⁻⁵ Pa.s, respectively.
Computational aero-acoustics (CAA) simulation: The Acoustic Perturbation Equation (APE) was chosen for solving the confined near-field acoustic problem under consideration. This method was introduced by R Ewert & W Schroder5 as APE variant-2 equations, which can be used for low Mach number flows with incompressible CFD simulations. In addition, this method accounts for acoustic reflections in confined flow domains. The simplified APE variant-2 equations neglecting the convective terms for very low Mach numbers (M <<1) is given in Eqn. 1 as:
(1)
Here, Eqn. 1 represents the non-homogeneous wave equation where
is the acoustic pressure and
is called hydrodynamic pressure fluctuation, which is simply the pressure fluctuation calculated from the incompressible flow simulation.5,7 The variable, c denotes the sound velocity in the fluid medium which was set to 340 ms-1. The total sound pressure
is can be represented as the summation of
and
as seen in Eqn. 2, where
represents the non-propagating part of the sound pressure, which is often referred to as “pseudo sound”.10
(2)
In the near-field region (close to the source region),
is much larger than
, while in far-field only
will exist. For the current study, non-reflective boundary conditions were employed at the inlet and outlet, while reflective boundary conditions were specified at the walls. For the CAA simulation a time step of 0.0001 seconds was used. Both CFD and CAA simulations were performed using STAR CCM+ software (CD-adapco Siemens, TX, USA). To validate the CAA results, sound pressure was measured at different locations on the wall using a microphone and the spectrum of the measured sound was compared with the simulated total sound pressure
spectrum. More information on the experimental procedure of the sound pressure measurement can be found in the previous study.7
Proper orthogonal decomposition (POD): Proper Orthogonal Decomposition (POD) can be used to study the coherent flow structures in the flow domain. As denoted in Eqn. 3, POD can decompose a fluid flow quantity,
into spatial modes
with their respective time evolvements
.
(3)
Ideally, when the number of modes N
, the quantity
can be perfectly represented as the summation of orthogonal (linearly independent) mode shapes
multiplied by their time varying amplitudes
. For computational convenience,
can be approximated by considering only the highest energy containing N modes and neglecting the low energy modes. POD analysis delivers the results such that the mode numbers are arranged in a descending energy (i.e., from high to low with
being the highest energy mode).11 The procedure of calculating the POD modes and their time evolvements involves following steps.
Step 1: Creating the snapshot matrix
of size n×m which stores the flow quantity
at n number of points where each column of
holds the values at each time step up to m time steps.
Step 2: Performing the singular value decomposition on
to find orthonormal matrix V which contains the POD modes. (In Eqn. 4, V and W are orthonormal matrices and S is a diagonal matrix which contains the singular values. Columns of V contains the POD modes as shown in Eqn. 5)
(4)
(5)
Step 3: Calculating the time evolvement
of the mode
using the orthogonality condition of the modes.
(6)
In the current study, POD modes were calculated for the total sound pressure
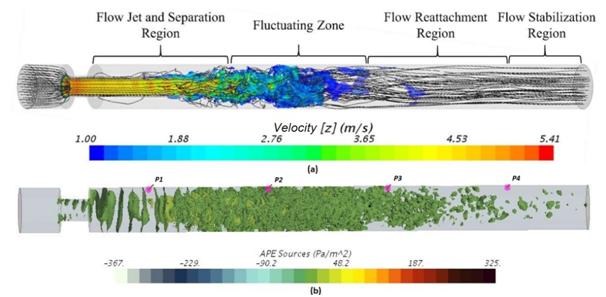
. The snapshot matrix contained of 1070 columns which saved the data for a duration of 1.07 seconds with a time step of 0.001 seconds. Due to computational limitations, data were only saved at ~ 1 million points in the volumetric region (which contains the “flow jet and separation region” shown in Figure 2), downstream of the constriction.

Figure 2 (A) Axial velocity results with velocity streamlines and flow region classification (B) Volumetric representation of instantaneous APE sources and measurement probes on the wall.
Figure 1A shows the axial velocity distribution plotted together with velocity streamlines. Here, the minimum value of the velocity scale is limited to 1 ms-1 to get a clear representation of the different flow regions observed in the flow domain, which were similar to previous studies,13,14 More details about CFD results can be found in the previous study.8 A volumetric representation of the APE acoustic sources (source term:
of Eqn. 1) is shown in Figure 2B. The acoustic sources seem to appear from the edges of the constriction and stay as more organized structures in the “flow jet and separation region”. They seem to get distorted as they reach the “fluctuating zone” and eventually disappear in the “flow stabilization region”.
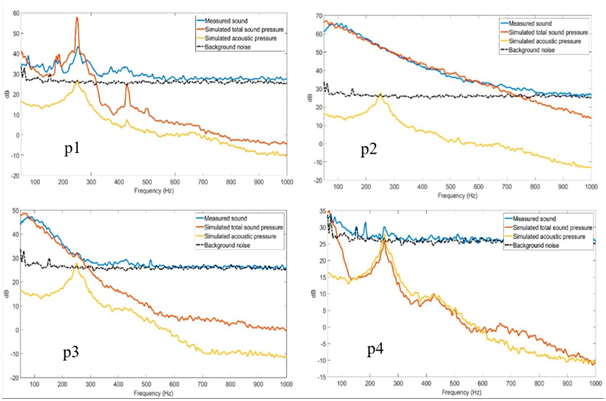
A comparison between the measured sound pressure spectra and the simulated sound pressure spectra at different locations on the wall are shown in Figure 3 for points p1,p2,p3,p4 (see point locations in Figure 2B). The simulated total sound pressure
spectra showed a good agreement with the measured sound pressure spectra (where typical spectral differences were within 9%). The sound pressure spectrum measured at p1 (in the “flow jet and separation region”) showed distinct frequency peaks where the dominant frequency was observed at ~250 Hz. At p2 (in the “Fluctuating zone”), the spectrum was more broadband in nature and the sound power decreased with frequency. The spectrum at p3 (in the “flow reattachment region”) showed lower sound power compared to the spectrum at p2. Sound pressure measured at p4 was lowest and close to the background noise. The simulated spectra showed that the difference between the total sound pressure
spectra and acoustic pressure
spectra decreased as the probe location moved further downstream from the “Fluctuating zone” which contains the strongest acoustic sources. These results also indicated that the high energy broadband frequencies existed in the “fluctuating zone” and decreased rapidly both upstream and downstream of this zone.

Figure 3 (A) Simulated and measured sound pressure spectra at probe points p1,p1,p3 and p4 (B) Locations of points is shown in Figure 2(B).
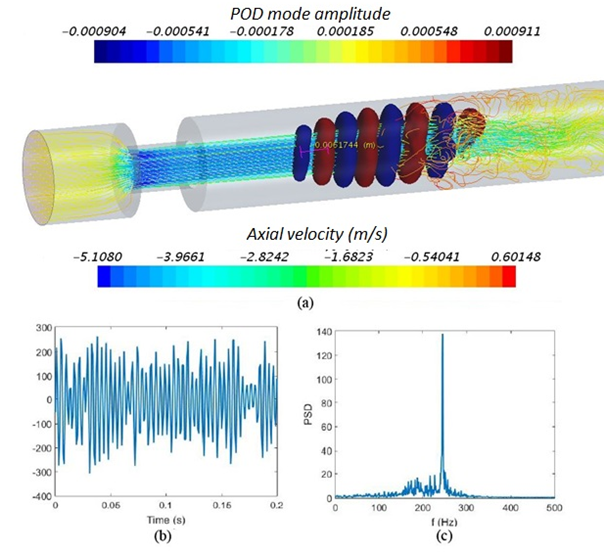
Figure 4 shows the information about the highest energy POD mode observed inside the “flow jet and separation region”. The spectrum of the time evolvement of this POD mode showed a peak frequency at 249 Hz, which corresponds to the peak observed in the sound pressure spectrum measured at p1. The mode shape results (Figure 4) showed ring like structures with maximum and minimum values alternatingly adjacent to each other in the region where the high velocity jet starts to separate. These structures were disoriented when the flow reached the “fluctuating zone”. These results suggest that the measured sound at ~249 Hz is generated at the flow separation region of the high velocity jet, which is likely associated with the convection of organized eddy structures in the jet shear layer.2,7 In addition, the simulated sound pressure results (Figure 3) indicated that the sound pressure waves at 249 Hz propagate to far-field as acoustic pressure.

Figure 4 (A) Volume representation of highest energy POD mode of total sound pressure (using iso-surfaces of the maximum and minimum values) (B) time evolvement of the highest energy POD mode (C) Spectrum of the time evolvement.
Flow generated sound field in a constricted pipe at low Mach number flow was simulated using a hybrid computational aero-acoustics (CAA) approach based on acoustic perturbation equations (APEs). CAA results were validated by comparing the simulated sound pressure spectra with measured sound pressure spectra. Acoustic sources and the sound propagation were discussed in relation to the flow dynamics observed in different regions of the flow domain. Proper orthogonal decomposition (POD) of the sound pressure gave insights about the acoustic sources which corresponds to the frequency peaks observed in the measured sound pressure spectra. The employed CAA method and analysis techniques can be used to investigate sound generation mechanisms in biomedical applications such as phonation and airway obstructions.
The author declares there are no conflicts of interest.


