Journal of
eISSN: 2572-8466


Respiration is commonly monitored using direct measurement of airflow with a mouthpiece or other access to breathing airflow. Indirect methods, such as those based on electrocardiography or chest impedance, may be advantageous especially if they already need to be performed. When direct access to breathing airflow is difficult or inconvenient an indirect approach may be needed. Some physiological signals are known to be affected by respiration, suggesting possible utility for extracting a respiratory signal from these signals. In the current study, the performance of several non-invasive methods for respiratory flow monitoring was compared. The study investigated the correlation between lung volume changes and other physiological signals including: chest wall movement (WM), chest galvanic skin response (GSR) and seismocardiographic (SCG) signals. Respiratory airflow was simultaneously measured along with the proposed candidate modalities. The measured airflow signal was integrated to determine lung volume changes, which was chosen as the reference signal. A respiratory signal was extracted from each of the proposed modalities and compared with the lung volume signal. Using airflow measurements, the average respiratory rate was found to be 13.8 breath per minute in the study subjects. Comparisons of the respiratory rate from different methods suggested that the respiratory rate was successfully detected by all proposed methods (accuracy between 85-100%). The ability of different methods to detect the correct respiratory phase in the time domain varied. Among the proposed methods, GSR was found to have the highest agreement with the reference method in respiratory phase detection (94-98%). This indicates that GSR may be used to accurately identify both respiratory rate and lung volume phases. One important GSR benefit is that it only requires chest surface sensors, which would offer operational advantages when direct access to breathing airflow stream is undesirable.
Keywords: respiratory phase, respiratory rate, galvanic skin response
Respiration detection is a vital part of patient monitoring, especially in critical care settings. Approaches for direct respiration measurement tools include spirometers and thermocouples, which measure air flow, or air temperature, respectively.1 Indirect methods, such as those based on electrocardiography or chest impedance, may be advantageous especially if they need to be performed anyway. Direct methods require immediate connections to the mouth, nose or breathing circuit, which may increase monitoring system complexity or present interference with the measured values.2,3 An earlier study4 proposed performing spirometry in the sitting position, which can be impractical for post-op or ICU patients. Surveillance using direct methods for prolonged periods of time or during ambulatory monitoring may be compromised due to an impracticality or patient inconvenience or low intolerance for face masks. Less invasive means of respiration monitoring may help avoid these potential limitations. Multi lead ECG signals were used to extract respiration signals in a previous study.2 A few studies5,6 suggested that transthoracic impedance can be correlated with respiration. Recent studies7–11 suggested that lung volume changes due to respiration significantly affect Seismocardiographic (SCG) signals. This suggest that SCG may be used for extracting respiratory signals noninvasively.
The goal of this study is to detect respiration information from various physiological signals including: chest wall movement, ECG, chest galvanic skin response (GSR) and SCG signals. All respiration signals considered will be compared with simultaneously acquired lung volume changes from direct respiration airflow measurements. This permits the identification of signals that best correlate with the direct respiration measurement. Figure 1 shows the physiological signals of interest plotted over a period of 20 seconds. The signals showed a period of oscillation that is potentially similar to the lung volume signal.
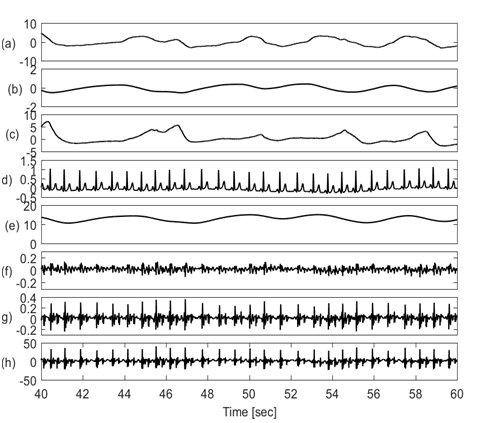
Figure 1 Physiological signals in time domain showing (a) Respiratory airflow, (b) Lung volume, (c) chest wall movement by piezo-electric sensor, (d) ECG, (e) Galvanic skin response, (f) SCG in craniocaudal axis, (g). SCG in lateral axis, (h) SCG in dorsoventral axis. All other signals (c to h) appear to potentially have components at the respiratory frequency, which indicates that respiratory information may be extracted from these signals.
Measurements of the signals
Twelve subjects (6 males and 6 females, age: 20–32 years) volunteered to participate in the study after IRB approval. The subjects were requested to lay on a bed tilted to 45degrees head up position. A spirometer (Model: A-FH-300, iWorx Systems, Inc., Dover, NH) was placed into subject’s mouth to measure respiratory flow rate. The lung volume signal was found from the time integral of this flowrate. The chest wall movement (WM) was measured by a piezo electric sensor attached to an elastic strap that was placed over the chest. (Model: RM-204, iWorx Systems, Inc., Dover, NH). ECG was acquired by a Biopotential Recorder (Model IX-B3G, iWorx Systems, Inc., Dover, NH) in lead 2 configuration. Simultaneous chest GSR signal was acquired using two separate electrodes attached next to subject’s right clavicle and left abdomen. Seismocardiographic signals were acquired using a tri-axial accelerometer (Model: 356A32, PCB Piezotronics, Depew, NY), which was placed on the chest surface at the 4th intercostal space near the left lower sternal border. The accelerometer was attached to the chest surface using double sided medical-grade tape. All signals were acquired simultaneously at a sampling frequency of 10 kHz to provide a temporal resolution of 0.1 ms. The acquired data was analyzed using Matlab (Matlab 2013, Mathworks, Natick, MA). The mean of each signal was subtracted for respective signals to remove the DC component of the signal.
Signal analysis
Three different methods were applied to extract the respiratory signal from the measured signals. These methods rely on calculating the: (a) baseline wondering, and (b) amplitude modulation (c) frequency modulation.
Figure 2 shows the physiological signals with their upper and lower envelopes suggesting that baseline and amplitudes of these signals noticeably vary with respiration.
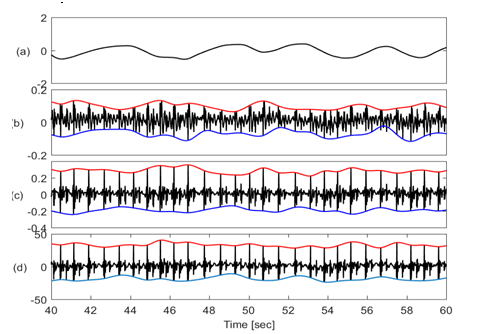
Figure 2 Traces of different physiological signals (a) Lung volume (b) SCG-craniocaudal with upper & lower envelope (c) SCG-lateral with upper & lower envelope (d) SCG-dorsoventral with upper & lower envelope. SCG envelopes suggest that the baseline wondering, and amplitude modulation of these signals have a period similar to respiration.
Calculating baseline wondering and amplitude modulation of SCG signals
The baseline of each signal was extracted by a band pass filtering the signal around the respiratory frequency (passband 0.1to 0.25 Hz). The amplitude modulation of SCG was calculated as the difference between the upper and lower envelope of ECG and SCG signals, such as:
Figures 3 & 4 show the baseline wondering and amplitude modulation of SCG signals plotted along with lung volume changes that are calculated from respiratory flow measurements.
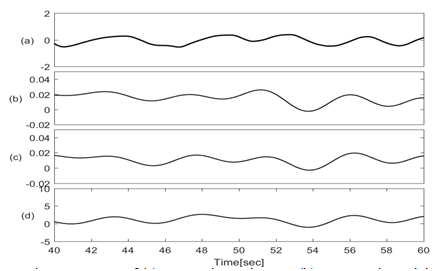
Figure 3 Traces of (a) Lung volume changes; (b) SCG-craniocaudal baseline; (c) SCG-lateral baseline; (d) SCG-dorsoventral baseline signals.
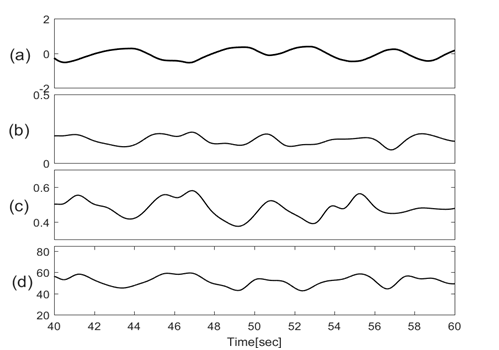
Figure 4 Traces of (a) Lung volume changes; (b) Amplitude modulation of SCG-craniocaudal; (c)Amplitude modulation of SCG-lateral; (d) Amplitude modulation of SCG-dorsoventral.
Calculating frequency modulation of ECG & SCG signals
The R-R interval of ECG signals is known to vary with respiration. In addition, earlier studies7–11 suggested that SCG-SCG intervals also tend to vary with respiration. This frequency modulation can be used to extract respiration information from these signals. To calculate the frequency modulation, the R-peak of ECG events were identified. Next the corresponding SCG peaks were found (Figure 5). The interval between each two consecutive peaks provide a measure of the beat to beat time. These intervals were plotted with respect to time and compared with lung volume signals (Figure 6).
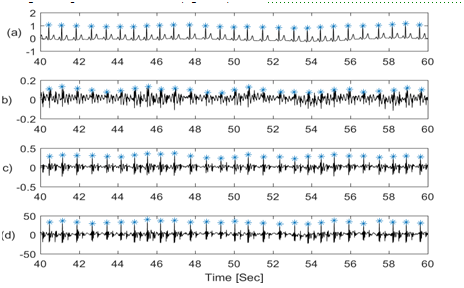
Figure 5 Traces of (a) Flow (b) Lung volume (c) amplitude modulation from ECG (d) amplitude modulation from SCG-craniocaudal (e) amplitude modulation from SCG-lateral (f) amplitude modulation from SCG-dorsoventral signal.
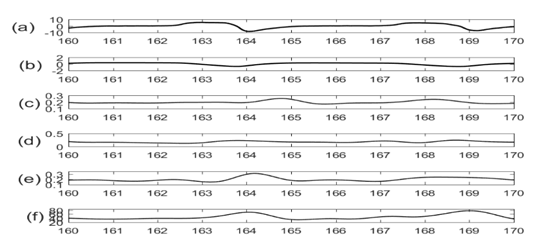
Figure 6 (a) Lung volume signal, (b) Chest wall movement signal; and Traces of frequency modulated signal for (c) ECG, (d) SCG cranio-caudal, (e) SCG lateral, (f) SCG dorso-ventral directions. The frequency modulated signal showed similar periodicity as the respiratory signal.
Phase match between lung volume and other signals
To examine how well the extracted signals match respiratory phase, the signals were compared with a reference signal (namely, the lung volume change signal) in the time domain. To investigate phase match between any two signals (e.g., a test vs. a reference signal), the zero crossings of the signals were compared. The sign (positive or negative) of each signal at each data point was used to calculate a “Sign match index” such that:
A match in signal phase occurs when the “Sign match index” is positive at that time (i.e., the reference signal and the test signal have the same sign). A negative match index would then represent a phase mismatch between the reference and test signals. Figure 7 shows an example of testing phase match between lung volume change (reference signal) and ECG baseline wonder (test signal) over a period of 10 seconds
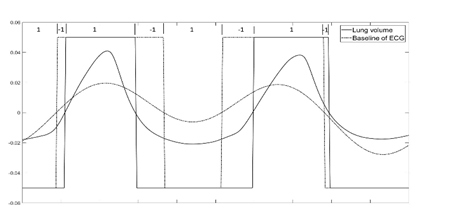
Figure 7 Traces of reference signal (Lung volume change) and test signal (baseline wondering of ECG) plotted along with their sign. The sign of each signal is also plotted, and the Sign match index is shown on the top of the graph. A Sign match index > 0 shows the region of phase match between the signals while a negative value indicates phase mismatch.
To calculate overall phase match between reference and test signal, the % Phase match was calculated as:
The average respiratory rate was calculated for all the signals of interest and all 12 subjects. This is plotted in Figure 8. The results shown in Figure 8 suggest that the average respiratory rate was 14 with standard error of 4 breath per minute. Subsequent analysis suggested that the overall accuracy in detecting respiratory rate using all modalities varied between 85-100% with GSR having the highest in accuracy (100%). The %Phase match for each test signal for 8 subjects is plotted in Figure 9.
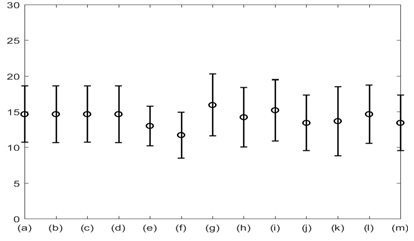
Figure 8 Average respiratory rate with standard error for: (a) Lung volume change; (b) Chest wall movement; (c) GSR; baseline wonder of: (d) SCG-craniocaudal, (e) SCG-lateral, and (f) SCG-dorsoventral; amplitude modulation for: (g) SCG-craniocaudal; (h) SCG-lateral; and (i) SCG-dorsoventral; and frequency modulation for: (j) ECG, (k) SCG-craniocaudal, (l) SCG-lateral, and (m) SCG-dorsoventral signal for all 12 subjects. The average respiration rate was found to be around 14 with a standard error of 4 breath per minute.
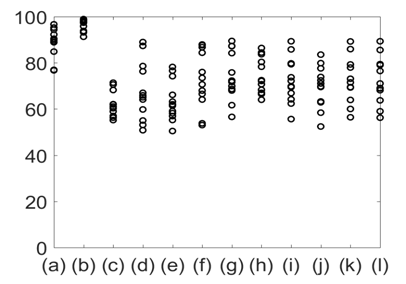
Figure 9 %Phase match between the reference signal (lung volume) and other signals. (a) Chest wall movement; (b) GSR; baseline wonder of: (c) SCG-craniocaudal, (d) SCG-lateral, and (e) SCG-dorsoventral; amplitude modulation for: (f) SCG-craniocaudal, (g) SCG-lateral, and (h) SCG-dorsoventral; and frequency modulation for: (i) ECG, (j) SCG-craniocaudal, (k) SCG-lateral, and (l) SCG-dorsoventral signal for all 12 subjects. The phase match with the reference signals was highest for GSR.
Figure 10 shows the mean and standard deviation of %Phase match values of the different physiological signals with respect to lung volume. The results shown in Figures 9 & 10 indicate that the %Phase match values for different test signals varied from about 50% to 98%. The GSR signals showed the highest accuracy in the %Phase match (approximately 94%-98%) for all cases. The chest wall movement and SCG baseline wondering (in the craniocaudal, lateral, and dorsoventral directions) waveform also showed promising results (approximately 85%-94%, 70%-85% ,65%-90%, 65%-85% respectively).
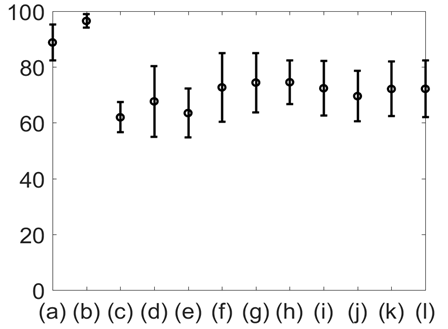
Figure 10 Mean and standard deviation of %Phase match for: (a) Chest wall movement; (b) GSR; baseline wonder of: (c) SCG-craniocaudal, (d) SCG-lateral, and (e) SCG-dorsoventral; amplitude modulation for: (f) SCG-craniocaudal, (g) SCG-lateral, and (h) SCG-dorsoventral , and frequency modulation for: (i) ECG, (j) SCG-craniocaudal, (k) SCG-lateral, and (l) SCG-dorsoventral signal for all 12 subjects. The chest GSR (b) had the highest ageement with the gold standard.
Respiration in the analysis of SCG signals
Earlier studies7,8,11 suggested that during inspiration, the chest wall expands, and the diaphragm moves downward causing a more negative intrathoracic pressure as well as a downward movement of the heart. Opposite phenomena happen during expiration.12 This intrathoracic pressure variations due to the change of respiratory phase may affect heart muscle contractile movements and blood flow momentum, which can significantly affect SCG morphologies. Therefore, it is important to know the respiratory phase of each SCG waveform during analysis. A reliable respiration signal from non-invasive source would help better separation of SCG events. The extracted signals considered in the current study provided a respiratory rate that is comparable to respiratory rate of the measured lung volume signal. Results suggest that the GSR signal showed best match in respiratory rate and phase with the lung volume signal. Hence, GSR can be used as a reasonable approximation of the lung volume signal. Among other signals, chest wall movement signal can be a used with an error of about 10%.
Limitations of extracting respiration from physiological signal
Earlier studies reported that the effects of respiration on ECG due to chest wall movement diminish with age.13–15 Hence an algorithm relying on these phenomena may have a lower performance for older subjects. More studies are needed to quantify the performance of the methods tested in the current study in a more diverse population including older subjects.
In this study, 6 different physiological signals for detection of the respiratory cycle were acquired. Respiratory waveforms extracted from these signals were compared with direct respiration measurement (gold standard reference signal in the current study). All extracted signals showed similar respiratory rate. However, when signals were compared in the time domain, performance varied considerably and phase matching relative to the reference signal varied from 50% to 98%. Chest GSR and chest wall movement were most accurate followed by SCG baseline wondering.
None.
The author declares there are no conflicts of interest.

© . This is an open access article distributed under the terms of the, which permits unrestricted use, distribution, and build upon your work non-commercially.