Journal of
eISSN: 2572-8466


The intend of this work was to investigate whether some leaf parameters involved in the antioxidant mechanisms were differently expressed in two pea (Pisum sativum L.) cultivars characterized by different tolerance to Fe deficiency: cv. Kelvedon, tolerant and cv. Lincoln, susceptible. Both cultivars were grown in a full strength nutrient solution (C), in the absence of Fe (direct deficiency, DD) or in the presence of Fe and bicarbonate (induced deficiency, ID) for 12 days. Our results show that peroxidase activity and isoform expression increased in Kelvedon in both treatments, while it decreased in Lincoln plants grown in the presence of bicarbonate, suggesting the involvement of this activity improvement in Fe deficiency tolerance of pea plants. Interestingly, while only slight differences were reported between both cultivars under DD, the adaptation of Kelvedon under ID seems to be related, at least in part, to its greater ability to enhance the antioxidant defense at leaf level.
Keywords: antioxidant enzymes, bicarbonate, iron deficiency, pea
APX, ascorbate peroxidases; CHL, chlorophyll; CAR, carotenoid; DTT, dithiothreitol; DHAR, dehydroascorbate reductase; FRAP, ferric reducing ability of plasma; GR, glutathione reductase; H2O2, hydrogen peroxide; MDHAR, monodehydroascorbate reductase; MDA, malondialdehyde; NBT, nitroblue tetrazolium; POD, peroxidases; PVPP, polyvinylpolypyrrolidone; PVP, polyvinylpyrrolidone; PMSF, Phenylmethylsulfonyl fluoride; TCA, trichloroacetic acid; SDS, sodium dodecyl sulfate; SOD, superoxide dismutase; TBA, thiobarbituric acid; TPTZ, tripyridyl triazine; ROS, reactive oxygen species; DD, direct deficiency; ID, induced deficiency
Calcareous soils are frequent in the Mediterranean area, including Tunisia.1 In such environment plants are exposed to severe Fe deficiency, due to high pH and to the presence of bicarbonate lowering the bioavailability of this nutrient.2 This can compromise the growth and development of several leguminous species, which commonly face Fe deficiency-induced chlorosis. The presence of a wide variability of plant responses to low soil Fe availability has been reported, both among legumes and among other species.3,4 Several environmental conditions are reported to induce oxidative stress in plants.5 Mineral deficiencies are among the main stress factors affecting the activity of antioxidant enzymes.6 In fact, Fe is the cofactor of catalase (CAT, EC 1.11.1.6), non-specific peroxidases (POD, EC 1.11.1.7), ascorbate peroxidase (APX, EC 1.11.1.11) and Fe superoxide dismutase (Fe-SOD, EC 1.15.1.1),7,8 thus Fe deficiency can lead to a reduced effectiveness of the antioxidant system. Actually, Fe can lead to oxidative stress in plants not only when lacking, but also when present in excess, through the Fenton reactions.9 ROS can seriously alter the cellular metabolism through oxidative damage to lipids, proteins and nucleic acids.10,11 To mitigate the oxidative damage initiated by ROS, plants induce different mechanisms able to block the propagation of ROS-generating chain reactions. SOD, which has been referred to; as the first line of defence against ROS in plants,12,13 converts O2- to H2O2. Studies on different plant species grown under Fe deficiency showed increased SOD activity, mainly due to enhanced Cu/Zn or Mn-SOD isoform expression.14-16 PODs, through the production and scavenging of H2O2, can regulate its concentration in cell compartments, thus being involved in different plant processes, such as growth and biotic/abiotic stress responses.17 Some authors14,16 reported that Fe deficiency preferentially affected the activity of POD isoforms involved in H2O2 detoxification, rather than those involved in the maintenance of cell-wall structure. Ascorbate peroxidases (APX), Monodehydroascorbate Reductase (MDHAR), Dehydroascorbate reductase (DHAR) and glutathione reductase (GR) are the enzymatic components of an effective ROS-scavenging system, called ascorbate-glutathione (ASC-GSH) cycle that catalyzes H2O2 conversion into water.18 Besides its participation in H2O2 detoxification via ASC-GSH cycle, ascorbate can directly scavenge superoxide, hydroxyl radicals and singlet oxygen. As well, also glutathione, other than taking part to the ASC-GSH cycle, protects cells against oxidative stress by reacting non-enzymatically with ROS.19
The effect of Fe deficiency on the antioxidant response has been well addressed.20-22,15 but there is little and sometimes controversial information regarding the relationship between Fe shortage and secondary oxidative stress.15,23 In previous studies investigating the effect of Fe deficiency on some root parameters involved in antioxidant defence and lignification in two pea (Pisum sativum) cultivars commonly cultivated in Tunisia, we showed that their different tolerance to such constraint can be partially related to their different ability to modulate the antioxidant defence system at root level.24 With this regard, the aim of the present work was to verify if the different tolerance to Fe deficiency may be correlated to a different efficiency of the antioxidant systems particularly at the leaf level, in addition to a different degree of ROS generation; by introducing a growth condition in which Fe is present but scarcely available (ID treatment), we wanted to test if the different efficiency in Fe uptake exhibited by the two cultivars in this condition results in different oxidative stress. Therefore, we measured the activity of some enzymes involved in ROS production/detoxification, as well as the presence of H2O2 and the degree of lipid peroxidation (accumulation of the MDA-TBA complex).
Plant material and growth conditions
Seeds of Pisum sativum cultivars (cv. Kelvedon and cv. Lincoln) were selected at the Tunisian National Institute of Agronomic Research: INRAT on the basis of their different tolerance to Fe deficiency, which was assessed in previous work investigating physiological and metabolic parameters.1,25 Seeds were germinated for 6 days at 19°C in Petri dishes with filter paper constantly moistened with 0.1 mm CaSO4. Six-day-old seedlings were then transferred to a half strength aerated nutrient solution for 7 days and then similar sized seedlings were selected and cultured for 12 days as groups of 10 plants in 10 L of full strength aerated nutrient solution [1.25 mm Ca (NO3)2, 1.25 mm KNO3, 0.5 mm MgSO4, 0.25 mm KH2PO4 and 10 µm H3BO3, 1 µm MnSO4, 0.5 µm ZnSO4, 0.05 µm (NH4)6Mo7O24 and 0.4 µm CuSO4]. Three different treatments were established as follows: presence of 30 µm Fe(III)-EDTA (control, C), 0 µm Fe(III)-EDTA (direct Fe deficiency, DD) and presence of 30 µm Fe(III)-EDTA + 0.5 g L-1 CaCO3 + 10 mm NaHCO3 (induced Fe deficiency, ID). The pH was adjusted to 6.0 with NaOH for both C and DD treatments, while it reached pH 8.2 in the ID treatment. The ID treatment was intended to simulate the effect of a calcareous soil. Aerated hydroponic cultures were maintained in a growth chamber with a day/night regime of 16/8 h, 24°C/18°C, 60%/80% relative humidity and PPFD of 200 µmol m-2 s-1 at the plant level. The solution was renewed every 6 d.
Leaf pigment concentrations
The leaf pigment concentrations (chlorophyll a, b and carotenoids) were measured in alkaline acetone extracts according to the method of.26 Three replicates for each treatment and cultivar were performed (n=3).
Hydrogen peroxide in leaves
Concentration of H2O2 in leaves was determined by measuring the complex titanium-peroxide, according to the method of Brennan et al.27 as described by Ranieri et al.14 Fresh leaf tissue (0.5 g) was homogenized in cold 100% acetone at 1:2 ratio (w/v) and centrifuged for 10 min at 10,000 g then aliquots of 20% TiCl4OH in concentrated HCl were added to the supernatant. After the addition of NH4OH (0.2 ml/ml sample) in order to precipitate the titanium-peroxide complex, samples were centrifuged at 10 000 g for 5 min. The resulting pellet was washed five times in acetone and re-suspended in 2N H2SO4. The absorbance of the solution was spectrophotometrically determined at 415 nm against a blank containing H2O2 instead of sample extract. H2O2 content was calculated using a standard curve of known H2O2 concentrations from 0.1 to 1 mm. The concentration of H2O2 was assayed in two independent experiments in triplicate (n=6).
Leaf oxidative damage was determined as equivalents of Malondialdehyde (MDA) concentration following the method of Hernández et al.28 Two hundred mg of fresh leaf samples were homogenized in 2 ml of 0.1% Trichloroacetic acid (TCA) and the homogenate was centrifuged at 15 000 g for 10 min at 4°C. A 0.5 ml aliquot of the supernatant was mixed with 1.5 ml of 0.5% Thiobarbituric acid (TBA) prepared in 20% TCA and incubated at 90°C for 20 min. After stopping the reaction in an ice bath, samples were centrifuged at 10,000 g for 5 min. The supernatant absorbance was then measured at 532 nm. After subtracting the non-specific absorbance at 600 nm, MDA concentration was determined using the extinction coefficient 155 mM-1cm-1. The MDA concentration was assayed in two independent experiments in triplicate (n=6).
Non-enzymatic antioxidant activity
Total non-enzymatic antioxidant activity was measured using the Ferric Reducing Ability of Plasma (FRAP) assay according to Benzie et al.29 Young fresh leaf tissue (0.5 g) was homogenized in 5 ml of 80% methanol. The homogenate was then filtered and centrifuged at 12,800 g for 2 min. The FRAP assay was performed with FRAP reagent containing 1 mm 2,4,6-tripyridyl-2-triazine (TPTZ) and 20 mm FeCl3 in 0.25 M sodium acetate (pH 3.6). An aliquot of 100 µL of leaf extract was added to 2 ml of FRAP reagent and thoroughly mixed. After the mixture was left at 20°C for 5 min, absorbance was measured at 593 nm. Calibration was made against a standard curve (25-1600 mm ferrous iron) using freshly prepared ammonium ferrous sulfate. Six replicates for each treatment and cultivar were performed (n=6).
Antioxidant enzyme extraction and activity assays
All operations were carried out at 4°C. To test SOD activity we followed the method of Ranieri et al.30 Young fresh leaves (0.5 g) were ground in liquid N2 and homogenized in a cold medium containing 50 mm K-phosphate buffer (pH 7.0), 1 mm EDTA, 0.05% Triton X-100, 1 mm Na-ascorbate, 1mm DTT, 0.3 mm PMSF and 10% (w/w) Polyvinylpyrrolidone (PVP). After centrifugation at 12 000 g for 30 min, the supernatant was dialyzed overnight at 4°C. The activity assay was performed in a reaction medium containing 50 mm K-phosphate buffer (pH 7.8), 100 µm EDTA, 13 mm methionine, 75 µm of Nitro blue tetrazolium (NBT), 2 µm riboflavin and 50µl of enzyme extract. SOD activity was assayed by measuring its ability to inhibit the photochemical reduction of NBT. The absorbance was measured at 560 nm spectrophotometrically and the activity expressed as U mg-1 protein. One enzyme unit was defined as the amount of enzyme inhibiting 50% of NBT photo reduction. POD activity was assayed according to the method of Ranieri et al.31 Two g of young fresh leaves were ground in liquid N2 with 10% (w/w) polyvinylpolypyrrolidone (PVPP) and homogenized in a medium containing: 0.1 M Tricine-KOH buffer (pH 8.0), 10 mm Dithiothreitol (DTT), 10 mm MgCl2, 50 mm KCl, 1mm EDTA, 0.1% Triton X-100, 50 µg ml-1 Phenylmethylsulfonyl fluoride (PMSF). In particular for APX extraction 50 mm ascorbic acid (AA) was added to the buffer in order to maintain the enzymatic activity. After centrifugation at 14,000 g for 30 min at 4°C, the supernatant was dialyzed overnight and then tested for enzyme activity. APX activity was determined by following the absorbance at 290 nm for 3 min of a reaction mixture (3.75 ml) containing 100 mm phosphate potassium buffer (pH 7.5), 0.5 mm ASA, 0.2 mm H2O2 and 0.75 ml enzyme extract.32
GR activity was measured according to Edwards et al.33 by monitoring the rate of NADH oxidation as the decrease in absorbance at 340 nm for 2 min at 25°C using an extinction coefficient of 6.22 mm−1cm−1. The reaction mixture contained: 100 mm HEPES-NaOH (pH 7.8), 0.5 mm oxidized glutathione (GSSG) and 50 µl of enzyme extract. The reaction was started by the addition of 0.2 mm NADH. MDHAR activity was determined according to Jiménez et al.7 by monitoring the decrease in absorbance at 340 nm and 25°C for 2 min due to the oxidation of NADH. The reaction mixture contained: 50 mm Tris-HCl (pH 7.8) containing 0.2 mm NADH, 1mM reduced ascorbate (ASC), 0.5 U of ascorbate oxidase and 50 µl of enzyme extract. The reaction was started by the addition of NADH. DHAR activity was measured according to Dalton et al.34 by monitoring ASC formation via Dehydroascorbate (DHA) reduction at 265 nm and 25°C for 1 min. The reaction mixture contained: 50 mm K-phosphate buffer (pH 6.5), 0.1 mm EDTA, 4 mm DHA, 50 mm reduced glutathione (GSH) and 25 µl of enzyme extract. The reaction was started by the addition of DHA. The reaction rate was corrected for the non-enzymatic reduction of DHA by GSH and a factor of 0.98, accounting for the small contribution of the absorbance by GSSG, was used. Six replicates for each treatment and cultivar were performed for all enzyme activities measured (n=6).
Extraction of ascorbate and glutathione
Leaf samples were grounded in a cold mortar with liquid N2 and homogenized with 25 mm sulphuric acid (1000 µl/ 500 mg fresh weight). The homogenate was centrifuged at 16,700 g for 30 min at 4°C, and the supernatant was collected for the determination of ascorbate and glutathione contents.
Quantification of reduced (ASC) and oxidized (DHA) ascorbate
The assay is based on the reduction of Fe3+ to Fe2+ by ascorbic acid, since Fe2+ forms a red complex with Bipyridyl that absorbs at 550 nm.35 DHA was reduced to ASC by pre-incubating the sample with Dithiothreitol (DTT). After DTT excess was removed with N-ethylmaleimide (NEM), total ascorbate (ASC+DHA) content was measured. DHA content was then estimated as the difference between total ascorbate and ASC. A standard curve covering the range of 2.5-60 µM ASC was used. Six replicates for each treatment and cultivar were performed (n=6).
Quantification of reduced (GSH) and oxidized (GSSG) glutathione
The contents of GSH and GSSG were determined as described by Griffith36 based on the oxidation of GSH by DTNB (5,5’-dithio-bis-nitrobenzoic acid) to give GSSG and TNB (5-thio-2-nitrobenzene). GSSG was reduced to GSH by the action of glutathione reductase and NADPH. GSSG was assayed from the sample after the removal of GSH by 2-vinylpyridine and Triethanolamine derivatizations. The rate of DTNB reduction was recorded at 412 nm for 2 min. The contents were calculated using a standard curve. The GSH content was calculated from the difference between the total glutathione and GSSG. Six replicates for each treatment and cultivar were performed (n=6).
Native PAGE and SOD isoform visualization
Aliquots of leaf extracts prepared as above described for SOD activity assay.30 containing equal amounts of protein (50 µg per lane) were subjected to native polyacrylamide gel electrophoresis (PAGE) at 100 V for 2 h with a Mini Protean II cell (Bio-Rad, USA) using a stacking gel and a separating gel containing 5% (w/v) and 7.5% (w/v) acrylamide, respectively. Electrophoresis buffers and gels were prepared as described by Beauchamp et al.37 After electrophoretic separation, SOD activity was determined as described by Beauchamp et al.37 Pretreatment of gels with 5 mm H2O2 and 3 mm KCN before SOD staining allowed us characterize SOD isoforms as Cu/Zn-SOD, Fe-SOD or Mn-SOD. Mn-SOD is resistant to both inhibitors, Fe-SOD isoform is resistant to KCN and inhibited by H2O2, and Cu/Zn-SOD is inhibited by both inhibitors. The experiment was repeated three times with the same results.
Native PAGE and POD isoform determination
Aliquots of leaf extracts prepared as above described for POD activity assay31 containing equal amounts of protein (50 µg per lane) were subjected to native PAGE through a 7.5% polyacrylamide gel. Gel composition and preparation followed that described by Laemmli,38 in the absence of sodium Dodecyl sulfate (SDS) in all buffers. Peroxidase active bands were revealed by immersing the gels in a solution consisting of 100 mm Na-phosphate buffer (pH 6.5), 5.55 mm H2O2 and 0.1 % o-dianisidine until the entire POD bands were visible. The experiment was repeated three times with the same results.
Protein determination
The total protein concentration was quantified by the Bradford assay (Bio-Rad, Hercules, CA, USA) with BSA as the standard according to the method of Bradford.39
Statistical analysis
After the preliminary tests of the normality of errors and the homogeneity of variances, the variance analysis of data (TWO-WAY ANOVA) with cultivars and treatments as factors was performed using the SPSS 10.0 program. Means were compared using the Student’s test at p≤ 0.05 when significant differences were found. Data shown are means of three (leaf pigment concentration and isoform determination), six (H2O2 and MDA concentrations, ascorbate and glutathione contents and FRAP values in addition to antioxidant enzyme activities), and nine (gas exchange parameters) replicates for each treatment.
Leaf pigment concentration
Upon exposure to Fe deficiency, CHLa/CHLb ratio increased in both cultivars respect to the controls but to a higher extent in Lincoln (51 and 77% under DD and ID, respectively) than in Kelvedon (13% and 22%, respectively) (Table 1). Carotenoid concentration decreased in Fe-deficient leaves of bothcultivars (Table 1): as observed for CHL concentration, the adverse impact on this parameter was more marked in Lincoln in which decreases were 36 and 61% under DD and ID, respectively, whereas for Kelvedon they were 15% and 39% under DD and ID respectively) (Table 1).
CHL a/b Ratio |
Carotenoids (mg g-1 FW) |
|
Kelvedon |
||
C |
2.75 ± 0.04e |
0.33 ± 0.02a |
DD |
3.10 ± 0.12d |
0.28 ±0.02b |
ID |
3.36 ± 0.05c |
0.20 ± 0.01c |
Lincoln |
||
C |
2.81 ± 0.02de |
0.36 ± 0.01a |
DD |
4.25 ± 0.13b |
0.23 ± 0.02c |
ID |
4.96 ± 0.09a |
0.14 ± 0.01d |
Table 1 Effect of Fe deficiency on leaf pigments (chlorophyll a and b and carotenoids) concentration in leaves of two Pisum sativum cultivars (Kelvedon and Lincoln) grown in the presence of Fe (C: control), in the absence of Fe (DD) or in the presence of Fe plus bicarbonate (ID).
Values are means± SE (n= 3) and differences between means were compared using Duncan’s test at (P<0.05). In the case of significant interaction between treatment and genotype, values followed by different letters are statistically different (*P< 0.05; **P < 0.01; ***P< 0.001; n.s = not significant).
Oxidative stress indicators
Leaf H2O2 concentration (Figure 1) increased under ID treatment in both cultivars, but the increase rate was higher in the sensitive cultivar (2.2-fold) than in the tolerant one (24%) compared to the control. Under DD, H2O2 concentration remained close to the control value in the tolerant cultivar, whereas it was significantly increased (62%) in leaves of the sensitive one. Lipid peroxidation was assessed by measuring the accumulation of the MDA-TBA complex. Leaf MDA concentration (Figure 1) was significantly enhanced in both cultivars as a result of Fe deficiency, yet to a variable extent: in Kelvedon, increases over control values were 22 and 30% under DD and ID respectively, whereas they were much higher in Lincoln, ranging from 70 (DD) to 91% (ID).
Non-enzymatic antioxidant activity
In Kelvedon FRAP values increased by 91% and 48% under DD and ID respectively, as compared to the control. The values registered for the sensitive cultivar (Lincoln) slightly increased under DD, while no effect was detected under ID (Figure 2).
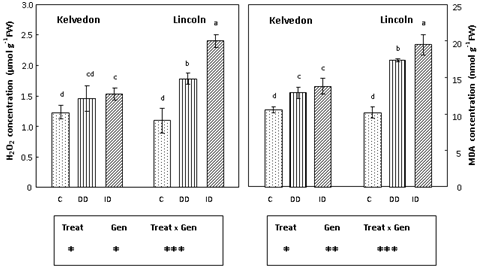
Figure 1 Effect of Fe deficiency on H2O2 and MDA concentrations in Kelvedon and Lincoln leaves grown in the presence of Fe (C: control), in the absence of Fe (DD: direct deficiency) or in the presence of Fe plus bicarbonate (ID: induced deficiency). Values are means ± SE (n = 6) and differences between means were compared using Student’s test at (P < 0.05).
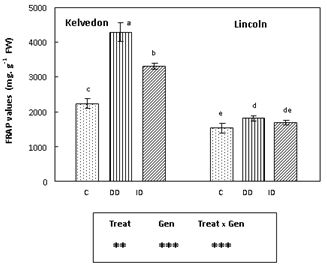
Figure 2 Effect of Fe deficiency on FRAP values in Kelvedon and Lincoln leaves grown in the presence of Fe (C: control), in the absence of Fe (DD: direct deficiency) or in the presence of Fe plus bicarbonate (ID: induced deficiency). Values are means ± SE (n = 6) and differences between means were compared using Student’s test at (P < 0.05).
Superoxide dismutase activity and isoform visualization
Irrespective of the cultivar, SOD activity (Figure 3) increased in Fe-deficient leaves. No differences were found between the cultivars in the DD treatment, but under the ID treatment the increase was much more pronounced in Lincoln (59%) than in Kelvedon (18%). To assess whether there were Fe deficiency induced differences among the individual SOD isoforms; SOD activity staining using non-denaturing gels was also performed (Figure 4A). Two major SOD isoforms were detected in the control leaf extracts of both cultivars. Testing their sensitivity towards KCN and H2O2 (data not shown) indicated that they were Cu/Zn-SOD and Mn-SOD. These isoforms were also revealed in DD-treated leaves of both cultivars and their activities seemed higher when compared to the control. As well, the same isoforms were detected in plants grown under ID, the increase being more marked in the sensitive cultivar.
Peroxidase activity and isoform visualization
POD activity (Figure 3) was similar in leaves of control plants from both cultivars. In the absence of Fe (DD), the activity showed a slight increase in both cultivars. The presence of bicarbonate in the growth medium resulted in an increase of POD activity in Kelvedon (2.5-fold) whereas a 50% decrease was observed for Lincoln. Native PAGE analysis (Figure 4B) revealed three major POD isoforms (POD L1, POD L2 and POD L3) in the control as well as in Fe-deficient leaves of Kelvedon. Under ID treatment an increase in POD L1 activity, associated to a decrease POD L2 and POD L3 activities was observed. These three POD isoforms were also present in leaf extracts of Lincoln plants under Fe sufficient supply, while POD L2 and POD L3 were not detected in Fe-deficient leaves of this cultivar. Furthermore, under bicarbonate supply the only isoform that was detectable (L1) showed a reduced activity.
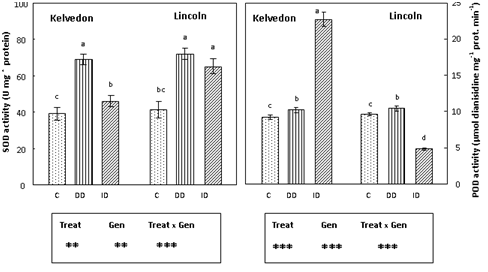
Figure 3 Effect of Fe deficiency on SOD and POD activities in Kelvedon and Lincoln leaves grown in the presence of Fe (C: control), in the absence of Fe (DD: direct deficiency) or in the presence of Fe plus bicarbonate (ID: induced deficiency). Values are means ± SE (n = 6) and differences between means were compared using Student’s test at (P < 0.05).
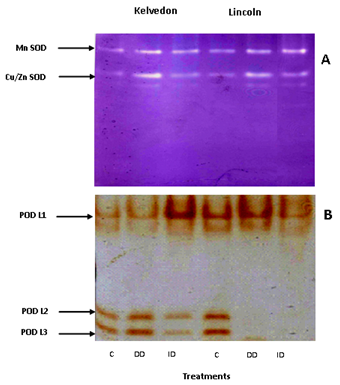
Figure 4 Activity staining following anionic PAGE for SOD (A) and POD (B) isoforms in Kelvedon and Lincoln leaves grown in the presence of Fe (C: control), in the absence of Fe (DD: direct deficiency) or in the presence of Fe plus bicarbonate (ID: induced deficiency). The figure is representative of three independent experiments.
Ascorbate-glutathione cycle enzymes
Since APX, GR, MDHAR and DHAR40 play a key role in the antioxidant defence through the regeneration of ascorbate and glutathione, their activities were assayed in leaf extracts of P. sativum grown under Fe deficiency conditions. APX activity (Figure 5) decreased in Fe-deficient leaves of bothcultivars. APX activity in Kelvedon was decreased by 61 and 40% under DD and ID respectively, whereas for Lincoln the reduction was lower (53% and 32% respectively under DD and ID). GR activity (Figure 5) was enhanced in Fe-deficient leaves of bothcultivars, with a higher increase in the tolerant one grown under ID (71%). Also MDHAR activity (Figure 6) increased in Fe-deficient leaves of both cultivars: the increase was greater under bicarbonate supply (ID) and more pronounced in the tolerant cultivar (94%) than in the sensitive one (46%). Concerning DHAR activity (Figure 6) a stronger increase was observed in Fe-deficient leaves of Kelvedon, while a lower effect was detected in Lincoln.
Ascorbate and glutathione contents
ASC content (Table 3) increased significantly in both cultivars grown in the presence of bicarbonate (+90% for Kelvedon and +30% in Lincoln), while in Kelvedon an increase of 25% was registered also in the absence of Fe. The same trend was noted for DHA content (Table 3): it was enhanced under ID for both cultivars and to a higher extent in Kelvedon than in Lincoln (2.2 and 1.6-fold compared to the control, respectively), whilst it increased also under DD only in Kelvedon. This resulted in an increase of the total ASC+DHA pool that was particularly strong in the tolerant cultivar under ID (+92% compared to the control) (Table 3). Fe deficiency, both direct and induced, reduced the ASC/DHA ratio irrespective of the cultivar, but a significant difference between the two cultivars was observed only under ID (Table 3). Fe deficiency decreased the reduced glutathione (GSH) content (Table 4) in both cultivars and no difference was observed between them. Both treatments (DD and ID) had no significant impact on the oxidized glutathione (GSSG) content (Table 4) in the tolerant cultivar, whereas a significant reduction was noted in the sensitive cultivar, with a higher reduction under DD (50%). This resulted in the drastic decrease in the total glutathione pool found in Lincoln under both DD and ID (Table 4). No effect was observed on the GSH/GSSG ratio in both cultivars (Table 4).
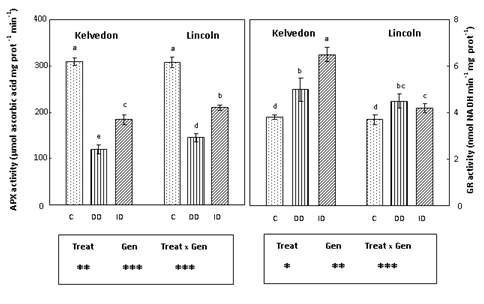
Figure 5 Effect of Fe deficiency on APX and GR activities in Kelvedon and Lincoln leaves grown in the presence of Fe (C: control), in the absence of Fe (DD: direct deficiency) or in the presence of Fe plus bicarbonate (ID: induced deficiency). Values are means ± SE (n = 6) and differences between means were compared using Student’s test at (P < 0.05).
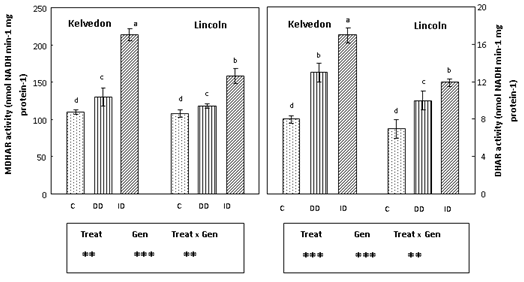
Figure 6 Effect of Fe deficiency on MDHAR and DHAR activities in Kelvedon and Lincoln leaves grown in the presence of Fe (C: control), in the absence of Fe (DD: direct deficiency) or in the presence of Fe plus bicarbonate (ID: induced deficiency). Values are means ± SE (n = 6) and differences between means were compared using Student’s test at (P < 0.05).
ASC (µg. g FW-1) |
DHA (µg. g FW-1) |
ASC + DHA (µg. g FW-1) |
ASC/DHA |
|
Kelvedon |
||||
C |
150 ± 18c |
10 ± 1e |
160 ±3d |
15 ± 1a |
DD |
188 ± 10b |
16 ± 1c |
204 ± 12b |
11.75 ± 1bc |
ID |
285±10a |
22 ±2a |
307 ±8a |
21.95 ±0.6b |
Lincoln |
||||
C |
147 ± 11c |
11 ± 2de |
157 ±5d |
13.36 ± 0.9ab |
DD |
160 ± 9c |
14 ±3d |
174 ± 3c |
11.42 ±0.3c |
ID |
195 ± 6b |
18 ± 2b |
213 ± 10b |
10.83 ± 0.2c |
Table 2Effect of Fe deficiency on ascorbate content in leaf pigments in leaves of two Pisum sativum cultivars (Kelvedon and Lincoln) grown in the presence of Fe (C: control), in the absence of Fe (DD) or in the presence of Fe plus bicarbonate (ID).
Values are means± SE (n= 6) and differences between means were compared using Student’s test at (P<0.05). The significance of the F-ratio following two-way ANOVA is shown. In the case of significant interaction between treatment and genotype, values followed by different letters are statistically different (*P < 0.05; **P < 0.01; ***P < 0.001; n.s = not significant).
GSH (nmol g-1 FW) |
GSSG (nmol g-1 FW) |
GSH+ GSSG (nmol g-1 FW) |
GSH/GSSG |
|
Kelvedon |
||||
C |
18 ± 2a |
13 ± 1a |
31 ±3a |
1.38 ± 0.1a |
DD |
11 ± 1b |
10 ± 2a |
21 ± 4cd |
1.1 ± 0.25a |
ID |
12 ±3b |
11 ±2a |
23 ±5bc |
1 ±0.3a |
Lincoln |
||||
C |
20 ± 4a |
12 ± 3a |
32 ±2a |
1.66 ± 0.2a |
DD |
8 ± 3b |
6 ±1c |
14 ± 3d |
1.33 ±0.3a |
ID |
9 ± 2b |
8 ± 2b |
17 ± 4cd |
1.12 ± 0.2a |
Treatment |
* |
* |
* |
n.s. |
Genotype |
* |
* |
* |
n.s. |
Trea X Gen |
* |
** |
* |
n.s. |
Table 3 Effect of Fe deficiency on glutathione content in leaves of two Pisum sativum cultivars (Kelvedon and Lincoln) grown in the presence of Fe (C: control), in the absence of Fe (DD) or in the presence of Fe plus bicarbonate (ID).
Values are means± SE (n= 6) and differences between means were compared using Student’s test at (P<0.05). The significance of the F-ratio following two-way ANOVA is shown. In the case of significant interaction between treatment and genotype, values followed by different letters are statistically different (*P< 0.05; **P< 0.01; ***P< 0.001; n.s. = not significant).
In a previous work,41 authors showed that the CHL concentration was significantly reduced under Fe deficiency, particularly in Lincoln. A similar trend was also observed for Fe2+ concentration in leaf tissues.25 Similar results were observed in other species such as sugar beet,22 grapevine42 and peach and pear.43 The decrease in concentration occurring not only for CHL, but also for carotenoids, suggests that the whole photosynthetic system is affected and undergoes structural modifications. The impairment in photosynthetic activity could trigger energy excess in photo systems and thus overproduction of ROS, causing oxidative damage. As already reported,16 the MDA and H2O2 concentrations were measured in leaves as indicators of oxidative stress. The lower level of lipid peroxidation found in Fe-deficient leaves of the tolerant cultivar respect to the sensitive one, notably when grown in the presence of bicarbonate (ID), suggests that Kelvedon plants are better protected than Lincoln ones from oxidative damage under Fe starvation. Van Breusegem et al.11 suggested that membrane damage might be caused by high H2O2 levels, which could accelerate the Haber-Weiss reaction, resulting in hydroxyl radical (OH-) formation and thus lipid peroxidation. The increase in H2O2 concentration observed in both cultivars under ID and in Lincoln also under DD could indicate this ROS as the main cause of lipid peroxidation observed under these treatments. In order to investigate the antioxidant responses in P. sativum plants under Fe deficiency, total leaf SOD and POD activities, which contribute to the plant defence against oxidative stress, were determined. An increase in SOD activity was detected in Fe-deficient plants of both cultivars, the effect of bicarbonate being stronger in Lincoln than in Kelvedon. In both cultivars, SOD activity was associated with an increase in the Cu/Zn-SOD and Mn-SOD isoforms. Concerning POD activity, it increased in both cultivars under DD, therefore the H2O2 accumulation detected only in Lincoln should be attributed not only to the increased SOD activity but also to other activities, such as NADPH-oxidases.44 In Kelvedon POD increase is mainly due to the induction of the L2 and L3 isoforms, while in Lincoln it is attributable to the sole L1 isoform (POD L1) that can be detected under this stress condition. However, the presence of some fast migrating POD isoforms cannot be ruled out. An important aspect of this work comes from the behavior of bicarbonate-treated plants: in Kelvedon, despite the slight H2O2 increase, POD activity is strongly induced, while a significant reduction was found in Lincoln, impairing the H2O2 scavenging effectiveness. These results suggest that under bicarbonate supply Kelvedon is able to maintain the Fe-dependent POD activities high, despite the low availability of Fe. In general, it can be inferred that in Lincoln the presence of bicarbonate led to a drastic decrease in POD activity and isoform expression, as well as to a lower increase of the non-enzymatic antioxidant activity, indicating that the H2O2 scavenging mechanisms are less effective compared to Kelvedon. Moreover, the differential regulation of distinct POD iso-enzymes may play a major role in stress tolerance of pea plants.
The ASC-GSH cycle, composed by the enzymes APX, GR, MDHAR and DHAR, is an important antioxidant process involved in the H2O2 elimination and ascorbate regeneration.18 There are few previous studies that describe the effect of Fe deficiency on the ascorbate-glutathione cycle enzyme.44 In both cultivars the decrease in APX activity, more severe under DD, can be attributed to insufficient Fe availability for the enzyme, which contains, other than the heme group, another Fe atom. Accordingly, a reduction in APX activity under Fe deficiency has been described in pear and quince genotypes.16 On the other hand, the increase in GR, MDHAR and DHAR activity, which is particularly strong in Kelvedon under ID, suggests that the tolerant cultivar responds to the presence of bicarbonate by activating the ASC-GSH cycle, thus regenerating antioxidant metabolites (ASC and GSH); these findings are in agreement with what found by Hernández et al.19 who documented ascorbate regeneration by DHAR in pea plants under salt stress. As anticipated by Hernández et al,19 the change in the ASC/DHA ratio which is an important indicator of the cell redox status, is one of the first signs of oxidative stress. In the present study, a significant decrease in the ASC/DHA ratio was found in both cultivars grown under both stress conditions, but this occurred particularly in Lincoln. Our results clearly show that the total glutathione pool (GSH+GSSG) is affected by Fe availability, particularly in Lincoln, while the GSH/GSSG ratio is kept constant in both cultivars. This explains the up regulation of GR activity, which must operate at a higher rate to regenerate the limited GSH pool. Taken together, these results suggest that Kelvedon plants, when grown in the presence of bicarbonate, maintain the functionality of the ASC-GSH cycle, the glutathione pool and the ratio GSH/GSSG, thus limiting the H2O2 accumulation in leaf tissues which can result from bicarbonate-induced Fe starvation.45-47
This study showed that the different tolerance to Fe deficiency in both P. sativum cultivars (Kelvedon and Lincoln) can be related to the different aptitude to modulate the antioxidant defence at leaf level. Kelvedon resulted to be more tolerant to bicarbonate-induced Fe chlorosis than Lincoln, as indicated by the enhancement of GR, MDHAR and DHAR activities and the accumulation of non-enzymatic antioxidants. These responses, together with the trends found for SOD and POD activities, could explain the lower H2O2 concentration and lipid peroxidation found in Kelvedon when compared to Lincoln under this growth condition. The different aptitude to induce the antioxidant mechanisms exhibited by both P.sativum cultivars can be ascribed to their different ability to take up Fe: in fact the antioxidant response is particularly expressed in Kelvedon when grown in the presence of bicarbonate, in which Fe is supplied, although scarcely available (ID), while in the absence of Fe (DD) the two cultivar exhibit a more similar behaviour. On the other hand, the better aptitude to grow under Fe-limiting conditions exhibited by Kelvedon plants can be partly ascribed to its effective antioxidant response itself, which limits the damages derived from Fe starvation; from this point of view the antioxidant response could be considered as an integral part of the complex adaptive response conferring to Kelvedon its high tolerance to lime-induced Fe deficiency, assessed both in the field1 and in hydroponics.25,41
This work was funded by the Tunisian Ministry of Higher Education, Research and Technology (LR02CB02).
The author declares no conflict of interest.

© . This is an open access article distributed under the terms of the, which permits unrestricted use, distribution, and build upon your work non-commercially.