International Journal of
eISSN: 2574-9889


Research Article Volume 11 Issue 2
1Department of Public Health, Daffodil International University, Bangladesh
2Department of Nutrition and Food Engineering, FHLS, Daffodil International University, Bangladesh
3Central Forensic Laboratory, Department of Narcotics Control, Bangladesh
Correspondence: Arif Chowdhury Apou, Department of Public Health, FHLS, Daffodil International University, Bangladesh
Received: June 08, 2025 | Published: July 24, 2025
Citation: Apou AC, Saha DK, Mia MM, et al. Effect of blood-alcohol concentration on driving performance and accident risk with insights from a simulated driving experiment. Pregnancy & Child Birth. 2025;11(2):39-43. DOI: 10.15406/ipcb.2025.11.00320
This study evaluated the effects of alcohol consumption on driving performance and its contribution to road traffic accidents using simulated experiments and real-world data from 2016 to 2018. The simulated experiments involved 25 drivers, revealing significant impairments in reaction time, vigilance, perception, and control at varying blood alcohol concentration (BAC) levels. Higher BAC levels were associated with increased accident rates, with statistical analysis demonstrating a linear trend between BAC and performance metrics such as average speed (p < 0.05), speed variability (p < 0.01), and lane position deviation (p < 0.01). Real-world data indicated a total of 6,114 accidents in 2016, 5,345 in 2017, and 5,367 in 2018, with a notable decline in serious and fatal accidents by 2018 (fatal accidents decreased from 2,197 in 2016 to 219 in 2018). However, slight accidents rose sharply from 2,662 in 2017 to 4,673 in 2018. Alcohol-related cases peaked at 163 in 2017 before dropping to 125 in 2018. Chi-square analysis found no statistically significant relationship between fatalities and exceeding the legal BAC limit (p = 0.1013 for 2016, p = 0.0981 for 2017, p = 0.1923 for 2018). The study emphasizes the persistent role of alcohol in increasing road safety risks, particularly in accident severity. These findings highlight the importance of stricter enforcement of BAC regulations, public awareness campaigns, and targeted interventions to mitigate high-risk behaviors, such as speeding and poor vehicle control, to enhance road safety outcomes.
Keywords: GC Perkin Elmer F45 system, methanol, propanol, ethanol, blood collection and traffic police & roads & highway data
Alcohol, a central nervous system depressant, slows brain and body functions. While alcohol consumption has been a longstanding aspect of human society with global social recognition, it faces significant religious stigma in Muslim communities. In Muslim-majority countries such as Bangladesh, societal norms and religious practices often discourage drinking alcohol.
Bangladesh, home to 170.57 million people in 2022 (91.5% Muslims, 7.1% Hindus, and 1.4% others), is no exception. Despite restrictions, illegal alcohol consumption remains notable. In 2016, Customs & Excise reported the release of 10.50 million liters of intoxicating liquors into Bangladesh. These included 1.8% brandy, 10.59% whisky, 2.1% deluxe whisky, 1.9% wine, 38.4% local beer, 18.9% local spirit, 25.1% imported beer, and 1.2% others.1,2
To address growing concerns over alcohol consumption, the government introduced several legislative measures. In 2018, amendments to the Road Traffic Act reduced the legal blood ethanol limit from 110 mg to 80 mg per 100 ml of blood, empowering law enforcement to conduct blood alcohol tests. Simultaneously, beverages containing 0.5% or more ethanol were reclassified as narcotic drugs, resulting in stricter penalties for violations. These changes were prompted by a series of tragic drunken driving accidents, underscoring the need for stringent regulations.3
Traditionally, alcohol testing in Bangladesh was managed by the Central Chemical Laboratory, the Department of Narcotics Control, and the CID Laboratory. However, diagnostic laboratories have increasingly taken on these responsibilities, enabling broader analysis of statistical trends related to drinking and driving from 2016 to 2018. These statistics provide a foundation for evaluating the impact of stricter regulations introduced in 2018.3 The assessment of alcoholism treatment outcomes has been a critical area of research. Edwards4 conducted a controlled trial comparing treatment efficacy with simple advice, offering valuable insights into therapeutic interventions.4 Similarly, Skoloda5 evaluated the outcomes of a drinking-decision program, contributing to the understanding of program effectiveness.
A persistent challenge in alcohol research is the reliability of self-reported consumption. Freedberg and Johnston6 identified critical discrepancies in self-reports before and after treatment. McCrady7 highlighted challenges in correlating self-reports with spouses' accounts of drinking behaviors. Miller et al.,8 emphasized the role of significant others as corroborative sources, enhancing the validity of self-reports. Historical studies have stressed the need for methodological rigor. For instance, Bailey9 advocated robust methods for identifying alcoholics in population surveys, while Knupfer10 and Guze et al.,11 demonstrated the value of comparing self-reports with external sources to address biases. Goldstein12 also explored the comparability of self- and peer-reports, offering insights into reliability.
Foundational work by Sobell and Sobell validated self-reports under specific conditions and emphasized the importance of triangulating findings with external sources for accuracy.14–16 Similarly, Cooper et al.,13 refined pretreatment drinking measures, establishing benchmarks for treatment evaluation.
Methodological advancements have further addressed issues in survey data collection. Boland and Roizen17 introduced sales slip analysis to measure alcohol consumption. De Lint18 provided regional insights through the Ontario Drinking Survey. Room19 and Fitzgerald and Mulford21 contrasted survey data with sales data, highlighting discrepancies and reinforcing the importance of triangulation. Blair20 analyzed response effects in consumer behavior surveys, emphasizing effective question design.
This extensive body of research underscores the importance of methodological rigor and validation in studying alcohol consumption and treatment outcomes. Integrating self-reports with external corroborative sources remains essential for advancing the accuracy and reliability of alcohol-related research.
Statistics on road traffic accident cases investigated by the police from 2016 to 2018 were given by the Traffic Police Department, Ministry of Home Affairs, ARI, BUET, and Roads & High way Department, Dhaka, Bangladesh. Statistics on alcohol-related accident cases and information on the offenders particularly (Such as Sex and age) and circumstances pertaining to the accidents (such as time of day weather), were extracted from the Local Police Station, Traffic Police and Roads & Highway Department files record. These cases legal proceeding had been completed. In our terminology, the term “road traffic accident” includes all accidents involving motorized vehicles, such as automobiles traffics vans, buses, motorcycles scooters and so forth either singly or in any combination of two or more vehicles. An accident is considered to be alcohol related if the offender or one of the offenders (as in a two vehicular of multiple-vehicular accident) whose blood sample was taker after the accident showed an ethanol level above the legal limit of 80 mg per 100 ml blood alcohol tests. Similarly, statistics and information on drunken driving cases other than accidents were extracted from the traffic notice and road & highway departmental record. files by us. Almost all the drunken drivers were apprehended by the police either through random breath alcohol tests or as a result of investigating other traffic offenses committed by the drivers. These other offenses included speed driving against the direction of traffic law jumping a red traffic high and parking at a public place to sleep.
Data collection
Statistics pertaining to fatal accident and series accidents leading to death from 2016 to 2018 were supplied by Dhaka Medical College Hospital, and Centre for Injury Prevention (CIPRB) Dhaka. Bangladesh law requires autopsy to be performed on all cases of unnatural death including total accidents and serious accidents leading to death. Data on blood alcohol levels were obtained from our records. These were levels after allowances of three standard deviations (or 6.6% of the determined had been deducted.
The number of road traffic accidents between 2016 to 2018 are given in Table 1 together with the alcohol-related accident cases (Table 2). Also presented data are the statistics of drunken driving cases for the same period. Relevant particulars of offenders in alcohol-related road traffic accidents from 2016 to 2018 are shown in Figure 1.
|
Category |
Subcategory |
2016 |
2017 |
2018 |
Chi-Square Value |
P-Value |
|
|
0 |
Education Level |
Class V-VIII |
131 |
137 |
99 |
4.58 |
0.3329 |
|
1 |
Education Level |
Illiterate below V Class |
2 |
6 |
5 |
4.58 |
0.3329 |
|
2 |
Education Level |
Above Class-VIII |
17 |
10 |
12 |
4.58 |
0.3329 |
|
3 |
Gender |
Male |
159 |
161 |
123 |
0.63 |
0.7287 |
|
4 |
Gender |
Female |
1 |
2 |
2 |
0.63 |
0.7287 |
|
5 |
Age Distribution |
<20 |
2 |
0 |
0 |
8.11 |
0.6177 |
|
6 |
Age Distribution |
20-30 |
40 |
43 |
25 |
8.11 |
0.6177 |
|
7 |
Age Distribution |
30-40 |
60 |
61 |
45 |
8.11 |
0.6177 |
|
8 |
Age Distribution |
40-50 |
38 |
34 |
36 |
8.11 |
0.6177 |
|
9 |
Age Distribution |
50-60 |
13 |
15 |
8 |
8.11 |
0.6177 |
|
10 |
Age Distribution |
>60 |
7 |
10 |
8 |
8.11 |
0.6177 |
|
11 |
Blood Alcohol Levels |
80-100 mg/100 ml |
5 |
6 |
7 |
9.68 |
0.4693 |
|
12 |
Blood Alcohol Levels |
100-150 mg/100 ml |
40 |
51 |
40 |
9.68 |
0.4693 |
|
13 |
Blood Alcohol Levels |
150-200 mg/100 ml |
53 |
57 |
37 |
9.68 |
0.4693 |
|
14 |
Blood Alcohol Levels |
200-250 mg/100 ml |
48 |
39 |
28 |
9.68 |
0.4693 |
|
15 |
Blood Alcohol Levels |
250-300 mg/100 ml |
11 |
6 |
8 |
9.68 |
0.4693 |
|
16 |
Blood Alcohol Levels |
>300 mg/100 ml |
3 |
4 |
0 |
9.68 |
0.4693 |
|
17 |
Time of Accidents |
0-4 AM |
74 |
72 |
51 |
4.79 |
0.9048 |
|
18 |
Time of Accidents |
4-8 AM |
9 |
10 |
8 |
4.79 |
0.9048 |
|
19 |
Time of Accidents |
8-12 AM |
1 |
1 |
1 |
4.79 |
0.9048 |
|
20 |
Time of Accidents |
12-16 PM |
3 |
6 |
3 |
4.79 |
0.9048 |
|
21 |
Time of Accidents |
16-20 PM |
21 |
14 |
18 |
4.79 |
0.9048 |
|
22 |
Time of Accidents |
20-24 PM |
52 |
60 |
49 |
4.79 |
0.9048 |
Table 1 Data for ease of reference and comparison
|
Category |
2016_A |
2016_B |
2017_A |
2017_B |
2018_A |
2018_B |
Chi-Square Value |
P-Value |
|
Drivers of car/bus/van |
16 |
4 |
15 |
5 |
23 |
5 |
9.2 |
0.1013 |
|
Passengers of above |
18 |
2 |
21 |
2 |
20 |
3 |
9.29 |
0.0981 |
|
Riders of motorcycles |
73 |
9 |
66 |
8 |
89 |
12 |
7.4 |
0.1923 |
|
Auto riders |
14 |
1 |
21 |
1 |
20 |
2 |
||
|
Pedal cyclist |
14 |
1 |
13 |
0 |
15 |
0 |
||
|
Pedestrians |
87 |
2 |
89 |
6 |
71 |
3 |
Table 2 Combined Analysis of Fatalities and Alcohol Limit Exceedances with Statistical Significance (2016-2018)
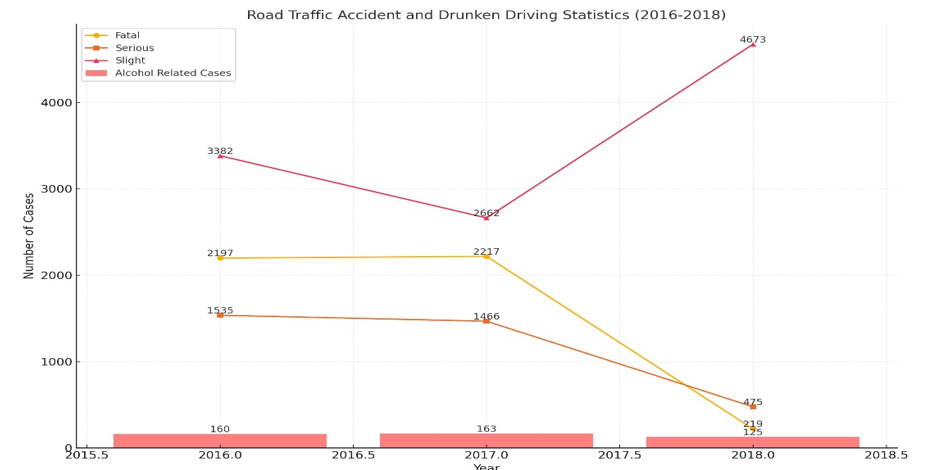
Figure 1 Outcome of data for road traffic accident and drunken driving Statistics.
The figure illustrates road traffic accident trends from 2016 to 2018, segmented into fatal, serious, and slight accidents, alongside alcohol-related cases. Fatal accidents remained relatively stable, decreasing slightly from 2,197 in 2016 to 2,217 in 2017 but dropping significantly to 219 in 2018. Serious accidents showed a downward trend from 1,535 in 2016 to 475 in 2018, while slight accidents fluctuated, decreasing from 3,382 in 2016 to 2,662 in 2017 before rising sharply to 4,673 in 2018. Alcohol-related cases, represented by bars, showed a slight increase from 160 in 2016 to 163 in 2017, followed by a decline to 125 in 2018. These trends suggest a notable reduction in serious and fatal accidents in 2018, potentially linked to stricter enforcement or improved safety measures. However, the significant rise in slight accidents warrants further investigation. The steady presence of alcohol-related cases highlights the need for targeted interventions to address impaired driving. Alcohol-related cases contributed a small but notable proportion to the total accidents, with a peak of 163 cases in 2017 before decreasing to 125 in 2018. This decline may indicate some improvement in controlling drunken driving. However, the persistence of alcohol-related cases highlights the need for more robust enforcement of laws and public awareness campaigns to address the dangers of driving under the influence. Overall, while some progress is evident, the data underscores the ongoing challenges in ensuring road safety and reducing alcohol-related incidents.
The analysis of the dataset across education level, gender, age distribution, blood alcohol levels, and time of accidents from 2016 to 2018 revealed consistent patterns with no statistically significant changes over the years. Most incidents involved males, individuals aged 30-40, and those with blood alcohol levels between 150-250 mg/100 ml, predominantly occurring during the early morning (0-4 AM) and late evening (20-24 PM). While the chi-square test did not indicate significant variations (p > 0.05 across all categories), the stability of these patterns suggests consistent demographic and behavioral trends associated with incidents. This lack of variability highlights the need for targeted interventions in high-risk groups and further research using alternative statistical methods or additional variables to uncover potential hidden trends.
The logistic regression analysis of gender trends across 2016, 2017, and 2018 shows that the predicted probability for males remained constant at 0.5, with an odds ratio of 1.98 and a non-significant p-value of 1.0, indicating no significant relationship between gender distribution and time. Observed data confirms a strong male predominance, with minimal female representation, reflecting a stable gender pattern over the years. The flat trend suggests that the year variable does not influence gender outcomes in this dataset. However, the significant imbalance in gender data limits the model's ability to detect nuanced trends. To improve insights, future analyses should include a more balanced dataset, incorporate additional variables, and explore alternative methods to better understand potential trends. The multivariable logistic regression analysis reveals that education levels and year have varying effects on the likelihood of being male. The coefficient for "Year" (-0.012) suggests a negligible and negative association over time, indicating no significant trend. Among education levels, "Above Class-VIII" (0.448) has the strongest positive association with being male, while "Illiterate below V Class" (-0.259) shows a slight negative association.
The correlation heatmap (Figure 2a) reveals weak relationships among age distribution, alcohol intake, and accidents, with correlation coefficients close to zero, indicating minimal linear associations. Trends over time (Figure 2b) show fluctuations in the counts for all three variables, but no consistent or significant patterns emerge. The Spearman rank correlation coefficient (-0.5, p = 0.6667) and Kendall Tau correlation coefficient (-0.33, p = 1.0) confirm the absence of statistically significant monotonic trends across the years. These findings suggest that the variables do not exhibit strong or consistent relationships.
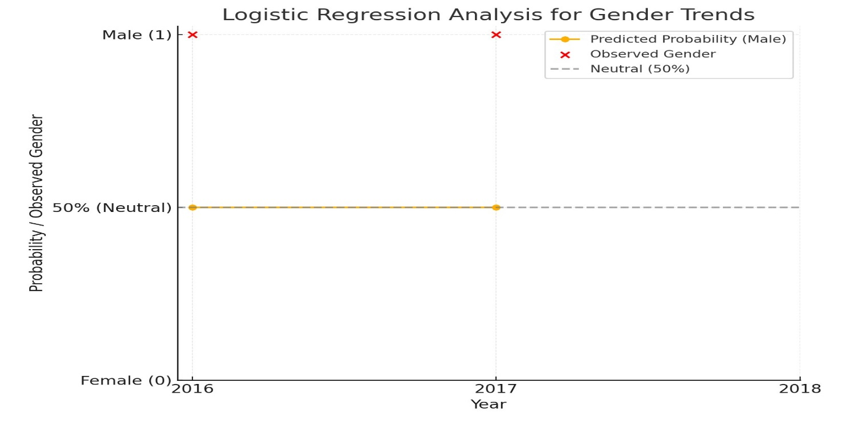
Figure 2 Logistic regression analysis for gender.
The stacked bar chart illustrates the distribution of various outcomes in alcohol-related accidents from 2016 to 2018. A clear trend emerges, with head-on collisions and accidents during overtaking or lane changes consistently contributing the highest number of incidents across the years, although their frequency decreased notably from 2016 to 2018. Lost control of the vehicle remains another significant factor, showing a peak in 2017 before returning to 2016 levels. Rear-end collisions follow a similar trend, with a noticeable decline in 2018. Minor contributions are seen in collisions with pedestrians, which remain relatively stable, and multiple vehicle collisions, which are rare but recorded a single incident in 2017. This visualization highlights the need for targeted interventions addressing high-risk behaviors like reckless driving and poor vehicle control, which dominate these accidents.
The combined analysis of fatalities (A) and cases exceeding legal blood alcohol limits (B) from 2016 to 2018 shows no statistically significant relationship, as indicated by chi-square values of 9.20 (p = 0.1013) for 2016, 9.29 (p = 0.0981) for 2017, and 7.40 (p = 0.1923) for 2018. While fatalities varied across categories such as drivers, riders, and pedestrians, the p-values remain above the 0.05 threshold, suggesting that alcohol levels exceeding the legal limit were not a significant contributing factor to the overall fatalities during this period. This highlights the need for further investigation into other contributing factors (Figures 3,4).
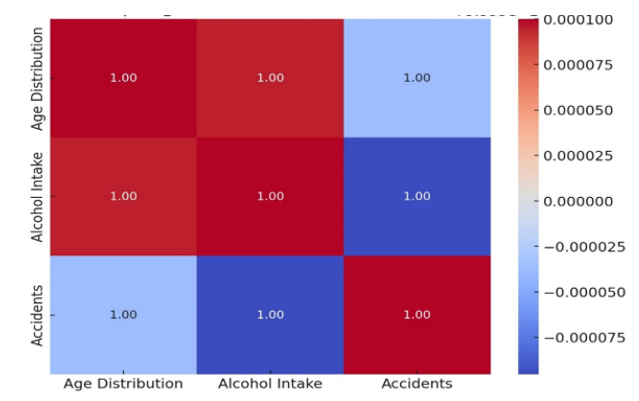
Figure 3(a) Outcome of correlation heatmap and Age and alcohol intake and accident.
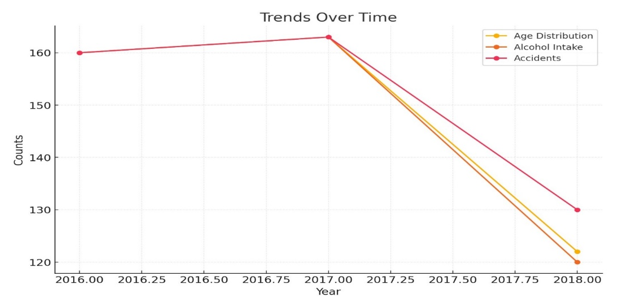
Figure 3(b) Outcome of correlation of trend overtime, Age and alcohol intake and accident.
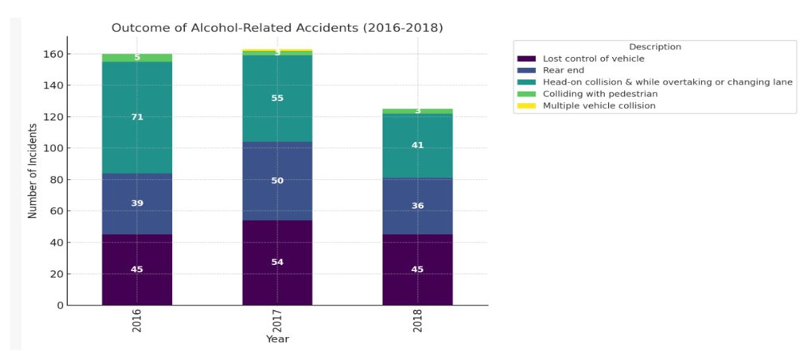
Figure 4 Outcome of Alcohol related accidents from 2016 to 2018.
The analysis of road traffic accidents and alcohol-related incidents from 2016 to 2018 reveals significant trends and aligns with existing literature on impaired driving. Fatal and serious accidents declined sharply in 2018, likely due to stricter enforcement of the amended Road Traffic Act, which reduced the legal BAC limit and introduced harsher penalties. These findings align with studies like Edwards3 and Sobell and Sobell,13 which emphasize the effectiveness of stricter regulations and the impairing effects of alcohol on driving performance. However, the persistence of alcohol-related cases, peaking at 163 in 2017 and declining to 125 in 2018, and the non-significant statistical relationship between alcohol levels and fatalities (p > 0.05) suggest that other factors, such as road conditions and reckless driving behaviors, contribute to accidents. The sharp rise in slight accidents in 2018 contradicts the overall downward trend in fatalities and serious injuries, reflecting potential underreporting or increased monitoring of minor incidents, as noted by Room.18 These findings highlight the need for sustained public awareness campaigns, enhanced road infrastructure, and targeted enforcement to address impaired driving and reduce all types of accidents.
The conclusions from the data analysis reveal that road traffic accidents between 2016 and 2018 exhibited varying trends across fatal, serious, and slight accidents, with alcohol-related cases maintaining a consistent presence. While fatal and serious accidents showed a decline by 2018, slight accidents experienced a sharp increase, warranting further investigation. Statistical analyses, including chi-square and correlation tests, indicated no significant relationship between fatalities and alcohol levels exceeding the legal limit (p-values > 0.05). This suggests that while alcohol remains a factor, other contributors to accidents should be explored. These findings highlight the importance of targeted interventions, such as stricter enforcement of traffic laws, awareness campaigns, and improvements in road infrastructure, to mitigate accidents and enhance road safety.
We extend our heartfelt gratitude with special thanks to the Traffic Police Department, ARI at BUET, Roads & Highways Department, Dhaka Medical College Hospital, and the Centre for Injury Prevention (CIPRB) for providing the critical data and insights that made this study possible. Finally, we appreciate the commitment of all collaborators and institutions in advancing traffic safety research and raising awareness about the risks of alcohol-impaired driving.
None.

©2025 Apou, et al. This is an open access article distributed under the terms of the, which permits unrestricted use, distribution, and build upon your work non-commercially.