International Journal of
eISSN: 2573-2889


Review Article Volume 3 Issue 2
1University of Buenos Aires, Physical Chemistry Division, Argentina
2University of Buenos Aires, Institute of Biochemistry and Molecular Medicine (IBIMOL), Argentina
Correspondence: Laura B Valdez, Cátedra de Fisicoquímica, Facultad de Farmacia y Bioquímica, Universidad de Buenos Aires, Junín 956, C1113AAD, Buenos Aires, Argentina, Tel (+) 54-11-5287-4235
Received: December 14, 2017 | Published: March 14, 2018
Citation: Valdez LB, Bombicino SS, Iglesias DE et al. Mitochondrial peroxynitrite generation is mainly driven by superoxide steady-state concentration rather than by nitric oxide steady-state concentration. Int J Mol Biol Open Access. 2018;3(2):56–61. DOI: 10.15406/ijmboa.2018.03.00051
In biological systems, ONOO- production depends on production rates of NO and O2-, and on the reactions of these two free radicals with other biological components, which limit the local concentrations of NO and O2-. In mitochondria, O2- is generated through the auto oxidation of semiquinones at Complexes I and III, and it may suffer the SOD-catalyzed dismutation reaction to produce H2O2 or react with NO in a classical termination reaction between free radicals. These diffusion-controlled reactions kinetically compete for O2- degradation. Results from our laboratory have shown that even in physiopathological situations in which NO production is reduced, such as the mitochondrial dysfunction associated to stunned heart, mitochondrial ONOO- production rate may be slightly increased if the steady-state concentration of O2- is augmented. The enhancement in O2- concentration leads to an increase in its degradation by reaction with NO, decreasing NO bioavailability and increasing ONOO- production rate. Therefore, mitochondrial ONOO- generation is mainly driven by O2- rather than by NO steady-state concentrations. In this scenario, the switch from NO-signaling pathways to oxidative damage takes place. The modification of crucial biomolecules by nitration or oxidation can lead to the bioenergetics failure that underlies physiopathological conditions such as neurodegenerative diseases, ischemia-reperfusion, Diabetes, endotoxic shock and aging.
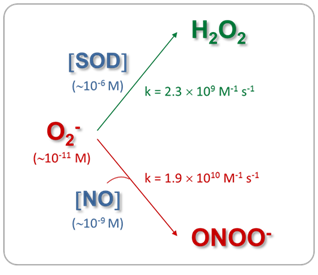
The mitochondrial matrix is a metabolically differentiated intracellular space concerning superoxide (O2-), nitric oxide (NO) and peroxynitrite (ONOO- ) metabolism because of the impermeability of the mitochondrial inner membrane to O2-, H+ and ONOO- and the specific presence of relatively high concentrations of Mn-superoxide dismutase (Mn-SOD), about 3-10 mM.1 Superoxide anion (O2-) is formed through the auto oxidation of ubisemiquinone2 at Complex III and of the flavin semiquinone of NADH dehydrogenises.3 In the mitochondrial matrix, O2- is consumed through two diffusion-controlled reactions (Figure 1): the disproportionate reaction catalyzed by Mn‑SOD (k=2.3´109 M-1 s-1)4,5 that produces O2 and hydrogen peroxide (H2O2);6‒9 and the reaction with nitric oxide (NO) to yield peroxynitrite (ONOO-; k=1.9´1010 M-1 s-1).10 Thus, from the kinetic point of view, these reactions compete for O2- degradation.
As a result of O2- disproportionation, isolated respiring mitochondria produce H2O2 at rates that depend on the redox state of the components of the respiratory chain and, consequently, on the mitochondrial metabolic state.6,11 The rates of H2O2 production of mitochondria isolated from mammalian organs are in the range of 0.4-0.9 nmol H2O2´min-1´mg protein-1 in state 4 and 0.05-0.15 nmol H2O2´min-1´mg protein-1 in state 3,1,7,11 being H2O2 generation in state 4 about 4-16 times higher than in state 3.1,9 Hydrogen peroxide in the mitochondrial cristae space originates largely from mitochondrial Complex III, whereas mitochondrial Complex I contribute to mitochondrial matrix H2O2.12 In the aristae subspace, “redox nanodomains” have been described which are induced by and control calcium signaling at the endoplasmic reticulum-mitochondrial interface.13 Hydrogen peroxide transients sensitize calcium ion release to maintain calcium oscillation. In this scenario, H2O2 is considered the major redox metabolite operative in redox sensing, signaling and redox regulation.14 While 1-10 nM H2O2 are considered physiological concentrations that play a role in redox signaling pathways under normal conditions, higher H2O2 concentrations lead to adaptive responses and supra physiological concentrations (>100nM) lead to damage of biomolecules.14
In addition, nitric oxide (NO) is produced through the reaction catalyzed by mitochondrial nitric oxide synthase (mtNOS), an isoenzyme of the NOS family located in the mitochondrial inner membrane that requires NADPH, L-arginine, O2 and Ca2+ for its enzymatic activity.15‒20 Mitochondrial NOS is a highly regulated enzyme.21 Several reports have shown that mtNOS is regulated by the O2 partial pressure in the inspired air,22‒25 the sympathetic autonomic system,26 the thyroid hormones,27insulin28 and angiotensin II.29 As well as H2O2 generation, mtNOS activity is modified by mitochondrial metabolic state:19,30,31 during the transition from resting to active respiration, NO release decreases about 40-45%. Nitric oxide production depends on mitochondrial membrane potential (Δy), being this dependence more important at physiological Δy range (150-180mV).30,31 In addition, mtNOS expression and activity are positively regulated in inflammatory processes32,33 and positively or negatively modulated by pharmacological situations,34 such as haloperidol,35 chlorpromazine36 and enalapril treatments.37 Moreover, changes in mtNOS activity and expression have been associated to the role of NO as signaling molecule involved in mitochondrial biogenesis,38,39 understood as de novo formation of mitochondria during the cellular life cycle. In turn, the product of mtNOS activity, i.e. NO, is an effective modulator of mitochondrial function40 through the inhibition that it exerts over Complex IV 41‒43 and Complex III44,45 activities. Mitochondrial NO is produced at rates of 1.0-1.5 nmol NO´min-1´mg protein-1 and kept at a steady-state level of about 10-9-10-8 M in the mitochondrial matrix.30
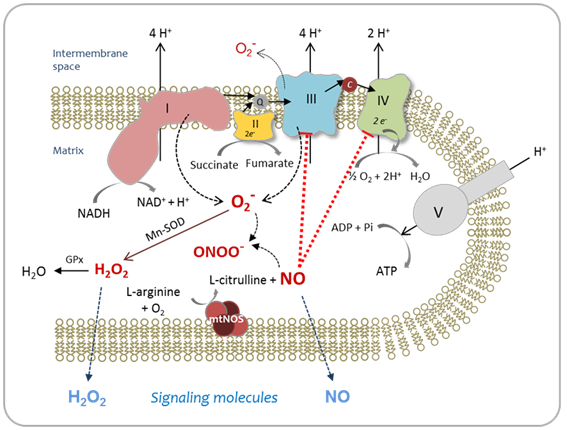
When O2- and NO are synthesized simultaneously and in close proximity, they will combine spontaneously to form ONOO-. This diffusion-limited reaction is a key element in deciding the roles of NO in physiology and pathology.46‒48 Peroxynitrite is a strong oxidant49 that can directly react with biomolecules by one or two-electron oxidations.50 Peroxynitrite oxidizes the sulfhydryl group of cysteine and glutathione (GSH),51 the sulfur atom of methionine,52 ascorbate,53 and the Purina and pyramiding bases of DNA.54 However, the reaction rate constants are relatively slow for these second-order reactions, ranging from 103 to 106 M-1s-1.44 Peroxynitrite is also able to start the lipoperoxidation process in biomembranes and liposome’s55 and in isolated LDL.56 In addition, ONOO- can promote protein tyrosine and tryptophan nitration, and lipid nitration that serve as important biological markers in vivo.57,47 Tyrosine nitration affects protein structure and function, resulting in changes in the catalytic activity of enzymes, altered cytoskeletal organization, and impaired cell signal transduction and is thus increasingly considered as a central aspect of peroxynitrite-mediated cytotoxicity.58,59 Nevertheless, ONOO- is normally reduced by the mitochondrial reluctant NADH, ubiquinol (UQH2) and GSH and kept at intramitochondrial steady-state level of about 5-10nM.59 When the steady-state concentration of ONOO- is enhanced at about 20-50nM, tyrosine nitration, protein oxidation and damage to Fe-S centers might take place. Therefore, the switch from signaling pathways of NO to oxidative damage takes place. Peroxynitrite production rate enhancement has been found in a series of clinical conditions such as Parkinson’s disease,60 ischemia-reperfusion61 diabetes,62 endotoxicshock,32 and aging.63 In these physiopathological situations, partial inactivation and dysfunction of Complex I (NADH: ubiquinone oxidoreductase) was also observed.64 Because of the fact that mitochondrial Complex I is the major entry point for feeding the respiratory chain with the reducing equivalents and that it is one of the H+ pumps that generates the mitochondrial DmH+ needed for the subsequent ATP synthesis, changes in Complex I activity lead to impairment of mitochondrial capacity to produce ATP and to cellular bioenergetics imbalance which underlies the above cited pathologies. Moreover, the increase in O2- production by modified Complex I intensify the enhancement in ONOO- generation, leading to a positive feedback toward oxidative damage. Figure 2 outlines the metabolism of reactive oxygen and nitrogen species, in the mitochondrial matrix.
Mitochondrial ONOO- generation depends on NO and O2- production rates and on the reactions of these two free radicals with other biological components, which limit the local concentrations of NO and O2-. Results from our laboratory have shown that even in physiopathological situations in which NO production is reduced, mitochondrial ONOO- production rate may be slightly increased if the steady-state concentration of O2- is augmented, with the consequent oxidation of biomolecules or modification of proteins by nitration.61,65 We have observed that in myocardial stunning61,65 and in streptozotocin (STZ)-induced diabetes,62,39 the cardiac mitochondrial dysfunction implied the reduction in state 3 O2 consumption sustained by glutamate-malate, the decrease in mitochondrial Complex I-III activity, and the enhancement in H2O2 production rate (Table 1), among others. However, while in the mitochondrial dysfunction produced as a consequence of hyperglycemia, an increase in NO production rate (23%) and in mtNOS expression (132%)39 were observed together with a reduction (50%) in Mn-SOD activity, in the mitochondrial impairment that accompanied the initial phase of stunned heart (15 min of ischemia and 30 min of reperfusion), a reduction in NO production rate (28%), without changes in mtNOS expression and SOD activity61 were detected, as expected for an acute stress model. Strikingly, an increase in tyrosine nitration (about 60-80%) of heart mitochondrial proteins was observed in both experimental models (Table 1).
Taking into account the experimental values of H2O2 and NO production rates in both physiopathological situations and the Mn-SOD concentration in the mitochondrial matrix calculated from Mn-SOD activity, the steady-state concentrations of O2- and NO and the ONOO- production rate were estimated (Table 1) .
|
Myocardial stunning# |
STZ-induced diabetes## |
||
|---|---|---|---|---|
|
Control (0/0) |
I/R (15/30) |
Control |
Diabetes |
H2O2 production |
0.18±0.02 |
0.32±0.04* |
0.40±0.19 |
0.91±0.08**** |
(nmol ´min-1´mg protein -1) |
||||
Mn-SOD activity |
53±5 |
56±3 |
143±22 |
71±8* |
(U´mg protein-1) |
||||
Active [Mn-SOD]### |
7.4±0.7 |
7.9±0.4 |
17±3 |
8.5±0.9 |
(mM enzyme) |
||||
NO production |
0.90±0.05 |
0.65±0.05** |
0.93±0.07 |
1.14±0.06* |
(nmol ´min-1´mg protein -1) |
||||
[NO] ss (1 -9 M) |
9.1 |
6.6 |
9.4 |
12 |
[O2-] ss (1 -11 M) |
4.8 |
8.1 |
4.7 |
21 |
ONOO- production (nM´s-1) |
8.4 |
10.1 |
8.4 |
46 |
Tyr nitration (%) |
100 |
178* |
100 |
158*** |
Table 1 Reactive species production rates and steady-state concentrations in heart mitochondria in physiopathological situations
#Experimental model of myocardial stunning: isolated rabbit hearts were exposed to ischemia (I; 15 min) and reperfusion (R; 30 min).
##Experimental model of type I Diabetes: rats were sacrificed after 28 days of Streptozotocin injection (STZ, 60 mgkg-1, ip.) and heart mitochondrial function was studied.
###The concentration of Mn-SOD (M enzyme) in the mitochondrial matrix was calculated as (M active center)/4, because mammalian Mn-SOD is a homotetramer with a manganese ion per subunit. The concentration of Mn-SOD active centers was calculated taking into account the value of Mn-SOD activity, the amount of commercial SOD that inhibits 50% ferricytochrome c reduction by each SOD unit (1 U SOD corresponds to 4 pmol SOD), the sample protein concentration (0.3–1.0 mg mitochondrial protein ml−1), and a volume of 7.2 l mitochondrial matrixmg protein−1.
*p<0.05, **p<0.01, ***p<0.001, ****p<0.005 significantly different respect to control (Myocardial stunning: one-way analysis of variance followed by Bonferroni multiple comparisons test; Diabetes, Student’s t-test).
Superoxide anion production rate was calculated from the experimental H2O2 production values and considering the 2:1 stoichiometry of the disproportionation reaction of O2- to H2O2,
- d [O2-]/dt = 2 d[H2O2]/dt
In the steady-state, the production rate is equal to the consumption rate of a chemical species. In the case of O2-,
- d[O2-]/dt = d[O2-]/dt
Superoxide is consumed by the reaction with NO (reaction I) and the disproportionation reaction (reaction II) catalyzed by SOD:
Mitochondrial NO is produced by mtNOS and released into the mitochondrial matrix where NO reacts with O2- (reaction I), ubiquinol (UQH2) (reaction III) and cytochrome oxidase (cyt aa3-e3+) (reaction IV):
Thus, NO production rate was expressed as:
d[NO]/dt =-d[NO]/dt = k1 [NO] [O2-]+k3 [NO] [UQH2]+k4 [NO] [cyt aa3-Fe2+]
Superoxide and NO steady-state concentrations ([O2-]ss and [NO]ss) were calculated from the equations 1 and 2, respectively, by mathematical iteration, and using the following rate constants: k1=1.9´1010 M-1 s-1;10 k2=2.3´109 M-1 s-1;4 k3=1.5´104 M-1 s-1;67 k4=4.0´107 M-1s-1.68
[O2-]ss=2d[H2O2]/dt /(k1[NO]+k2[Mn-SOD]) (Eq. 1)
[NO]ss=d[NO]/dt/(k1[O2-]+k3[UQH2]+k4[cyt aa3-Fe2+]) (Eq. 2)
Nitric oxide diffusion to and from cytosol was not included in Eq. 2. Ubiquinol and cytochrome aa3 contents were taken as 277mM and 5.6mM, respectively, considering a mitochondrial matrix volume of 7.0ml´mg protein-1. 66,69
Once the O2- and NO steady-state concentrations were calculated, the ONOO- production rate was estimated from Eq. 3, taking into account the second-order rate constant k1:
d[ONOO-]/dt=k1[O2-] [NO] (Eq. 3)
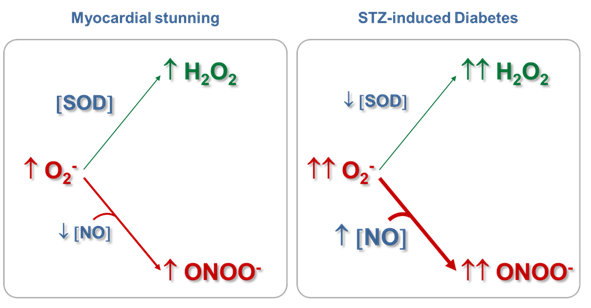
In the physiological conditions assessed (Table 1, control data), the mitochondrial O2- steady-state concentrations calculated were about of 0.05nM, because of its short half-life (50-100 ms) and its degradation by the reaction catalyzed by Mn-SOD. In these experimental situations, NO steady-state concentrations have resulted ~9 nM, more than 100-fold higher than O2- concentration. Therefore, the second-order reaction rate between O2- and NO to produce ONOO- is converted in a pseudo-first order reaction respect to O2-, being O2- concentration the driving factor to generate ONOO- in a given time. Consequently, under normal mitochondrial conditions, ONOO- production and concentration are relatively low. Moreover, taking into account that the rate constant of the ONOO- formation reaction is approximately 8 times higher than the rate constant of the O2- dismutation reaction, physiological concentrations of SOD (in mM range) can effectively compete with NO concentration (nM) for O2- consumption (Figure 1). It is known that in physiological situations, only about 15-20% of the O2- generated in mitochondria is catabolized through its reaction with NO; but this pathway consumes about 80% of mitochondrial NO. On the other hand, Table I shows that although the mitochondrial NO steady-state concentration is reduced (28%) in the stunned heart, the ONOO- generation is slightly increased (20%), mainly because of an increase (70%) in O2- steady-state concentration, leading to an increase (~80%) in nitration of tyrosine residues of mitochondrial proteins. Therefore, mitochondrial ONOO- generation is mainly driven by O2- steady-state concentration rather than by NO steady-state concentration. In pathological situations in which the O2- steady-state concentration is increased and Mn‑SOD expression is not modified, as it is the case in the stunned heart, the metabolic pathway of O2- degradation through its reaction with NO is exacerbated, leading to an enhancement in ONOO- generation (Figure 2). In addition, in experimental diabetes, an increase in the NO steady-state (28%) was observed together with a large increment in O2- steady-state concentration (3.5 fold), this latter as a consequent of not only the enhancement of O2- production but also the reduction in SOD active concentration. This physiopathological situation caused a 5-fold increase in ONOO- production rate in heart mitochondria from diabetic in comparison with control animals. Accordingly, when O2- formation is stimulated more than two-fold the rate of NO synthesis and Mn-SOD concentration is reduced, NO is quantitatively converted to ONOO- acquiring fundamental importance the ONOO--derived chemical reactions (Figure 3). The conversion from reversible inhibition of cellular respiration by NO to pathological inhibition of mitochondrial function by the NO-derived ONOO- has been observed in many physiopathological conditions, and it seems to be controlled by O2- steady-state concentration rather than by NO concentration. Mitochondrial dysfunction accompanied by ONOO- generation increase is a hallmark of heart hypoxia-reperfusion injury,60 sepsis,32 diabetes,61 among others. Moreover, these results agree with the modulation of the NO bioavailability in the vascular endothelium, another interesting microenvironment. In this case, an increased O2- production by NADPH oxidase (NOX 1 and NOS 2 isoforms) compromises the NO bioavailability, this latter fact associated.70 In a high-blood pressure experimental model, it has been observed that the flavanol(-)-epicatechin regulates NO bioavailability not only through the modulation of NOS activity but also by regulating O2- production and NOX expression, suggesting that the reaction between O2- and NO is a key pathway in the endothelium-dependent vasorelaxation process.70


To conclude, in physiopathological conditions, ONOO- generation is mainly driven by O2- steady-state concentration. The enhancement in O2- concentration increases its degradation by reaction with NO, declining NO bioavailability and increasing ONOO- concentration. This way, the switch from NO-signaling pathways to oxidative damage takes place, with protein tyrosine nitration, protein oxidation and damage to Fe-S centers. Among them, changes in Complex I structure and function can exacerbate ONOO- generation-secondary to O2- production rate enhancement-producing to a positive feedback toward oxidative distress, bioenergetics failure and the subsequent cell death.
This work was supported by research grants from the University of Buenos Aires (UBACYT 200-201-301-00731 and 200-201-601-00132), Agencies National de Promotion Scientific y Technological (ANPCYT, PICT 2014-0964), and Conseco National de Investigations Scientifics y Technical (CONICET; PIP 112-201-101-00444).
The author declares no conflict of interest.

©2018 Valdez, et al. This is an open access article distributed under the terms of the, which permits unrestricted use, distribution, and build upon your work non-commercially.