International Journal of
eISSN: 2573-2889


Research Article Volume 5 Issue 3
Department of Chemistry, University of Puerto Rico, USA
Correspondence: Elsie I Parés Matos, Department of Chemistry, Faculty of Biochemistry and Biophysical Chemistry, University of Puerto Rico at Mayagüez, PO BOX9000, Mayagüez, Puerto Rico, USA, Tel 17878324040, Fax 17872653849
Received: April 23, 2020 | Published: July 31, 2020
Citation: Fernández JRG, Pita XN, Meléndez E, et al. Interaction of metallocene dichlorides with apo-human transferrin: A spectroscopic study and cytotoxic activity against human cancer cell lines. Int J Mol Biol Open Access. 2020;5(3):79-109. DOI: 10.15406/ijmboa.2020.05.00136
Metallocene dichlorides (Cp2M(IV)Cl2) are the first class of small and hydrophobic organometallic compounds classified as anticancer agents against numerous cancer cell lines and tumors. In this study, the antiproliferative activities of Cp2VCl2,Cp2NbCl2, Cp2HfCl2 and Cp2ZrCl2were assessed on two human cancer cell lines (HT-29 and MCF-7) using MTT assay. Spectroscopic studies were also conducted using these and other known metallocene dichlorides on apo-human transferrin (apo-hTf) at pH 7.4. UV-Vis and CD showed that their interaction with apo-hTf could induce conformational changes of its secondary structure during binding process. In fluorescence, a decrease in intensity of the emission peak was observed when the apo-hTf:Cp2M(IV)Cl2 complex is being formed, probably due to changes in the microenvironment of its tyrosine and tryptophan residues. Among all metallocene dichlorides studied, Cp2VCl2 has the strong ability to quench the intrinsic fluorescence of apo-hTf through a static quenching mechanism. The association constants for each protein-compound complex were also determined at different temperatures (296 K, 303 K, 310 K, and 317 K) based on fluorescence quenching results. Positive enthalpy changes (ΔH) and entropy changes (ΔS) as well as negative free energies (ΔG) suggest that hydrophobic interactions are the main intermolecular forces involved in the binding process, probably via an endothermic and spontaneous reaction mechanism. The distance, r, between donor (apo-hTf) and acceptor (Cp2M(IV)Cl2) obtained according to Forster's theory of non-radiation energy transfer suggest that the energy transfer from apo-hTf to Cp2M(IV)Cl2 occurs with high probability and distances obtained by FRET with high accuracy.
Keywords: apo human transferrin, metallocene dichlorides, anticancer activity, spectroscopic analysis, protein-ligand interactions
apo hTf, apo human transferrin; ATCC, American type culture collection; CD, circular dichroism; CDDP or (NH3)2Pt(II)Cl2, cis-diamminedichloroplatinum (II); Cp2M(IV)Cl2, metallocene dichloride; CV, cyclic voltammetry; DMSO, dimethyl sulfoxide; EAT, ehrlich ascites tumour cells; FBS, fetal bovine serum; FRET, fluorescence resonance energy transfer; FTIR, Fourier-transform infrared spectroscopy; HT-29, human colorectal adenocarcinoma cell line; HTB, human tumor cell bank; IC50, median inhibitory concentration; MCF-7, human breast adenocarcinoma cell line; MEM, minimum essential medium eagle; MRE, mean residue ellipticity; MTT, 3-(4,5-imethylthiazol-2-yl)-2,5-diphenyltetrazolium bromide; NMR, nuclear magnetic resonance; PBS, phosphate buffered saline; Tris-HCl, tris(hydroxymethyl)aminomethane hydrochloride; UV-Vis, ultraviolet-visible
Metallocene dichlorides (Cp2M(IV)Cl2), also called bis(η5-cyclopentadienyl) metal dichlorides [(η5-C5H5)2-M(IV)-Cl2], typically comprise of earlier transition metals in a formal (IV) oxidation state (Figure 1A) with electron configurations d0 when M(IV)=Ti, Zr, Hf; d1 when M(IV)=V, Nb, Ta; and d2 when M(IV)=Mo, W.1,2 Structurally, these bis-cyclopentadienyl complexes are classified as bent metallocenes (Figure 1B), which have two η5-cyclopentadienyl (Cp) rings and two chlorine atoms coordinated to the metal atom.3,4 In a clinical context,metallocene dichlorides represents the first class of small and hydrophobic organometallic compounds classified as anticancer agents with antiproliferative activity.5,6 Several studies have established that their complexes exhibit high antitumor properties against numerous cell lines and in a wide range of murine and human tumors in vitro and in vivo7,8 such as solid and fluid Ehrlich ascites tumors (EAT);9–15 lymphoid leukemia L1210, lymphocytic leukemia P388 and L1210;16 human breast adenocarcinoma (MCF-7);17–19 human colorectal adenocarcinoma (HT-29) and Caco-2;19–22 human testicular tumors (Tera-2 and NTera-2);23solid and fluid sarcoma 180;24 solid B16 melanoma;25 colon 38 adenocarcinoma;25 Lewis lung carcinosarcoma;26 mouse mammary tumor TA3Ha;27,28 and several human colon adenocarcinomas (R85, CX-1 and C-Stg2),29–32 human lung carcinomas (L182 and L261);33 human breast adenocarcinoma (M3) and human stomach adenocarcinoma (M-Stg4);34 and human renal carcinoma (KTCTL-1M, -2, -26A, -30 and -84) xenografted into athymic mice.35

Figure 1 Transition metals as central atoms in antitumor agents. Some early and late transition metals (highlighted in yellow color) are known (A) to form Cp2M(IV)Cl2 and cisplatin, respectively. General representation of the molecular structure of a metallocene dichloride (B), where the angle M(Cl–M–Cl)=Ti+4 (94.6°),37 V+4 (87.1°),38 Mo+4 (81.3°/82.0°),39,40 Nb+4 (85.7°),39 Zr+4 (97.2°),39 W+4 (81.5°)41 and Hf+4 (98.0°).40 The molecular structure of cisplatin (C),where the Cl-Pt-Cl angle is 91.9°.42,43
Bent metallocenes, which have a cis-dichlorometal(IV) motif similar to cis-dichloroplatinum(II) of cisplatin (CDDP) (Figure 1C), are highly efficient and effective anticancer drugs considered as one of the most promising in the treatment of different types of cancer such as testicular, ovarian, head and neck, bladder, cervical, oesophageal and small cell lung cancer.9,10,15,36 Cellular studies on Cp2M(IV)Cl2 have shown similar results to cisplatin, and have implicated DNA as the principal cellular target in vivo showing that cellular uptake and intracellular localization of several bent metallocenes were accumulated in significant amounts at nucleic acid-rich regions such as the nuclear heterochromatin, euchromatin and nucleolus of tumor cells,44–46 inhibit cellular DNA biosynthesis,47–49 cellular mitotic activities,50–52 cellular RNA and protein biosynthesis53–55 andcellular growth14. These results and its molecular structural similarities to cisplatin ((NH3)2Pt(II)Cl2) led several authors to think that the anticancer activities of both Cp2M(IV)Cl2 and cisplatin compounds may have a similar DNA-binding mechanisms.15,47,53 However, later studies showed that bent metallocenes have a mechanism of interaction with DNA completely different to that of cisplatin.56–58 Among all metallocene dichlorides studied, titanocene dichloride (Cp2TiCl2) has been proved widely effective as a cytotoxic anticancer agent, which means that it can selectively kill cancer cells such as xenotransplanted human tumors of the colon, rectum, stomach, lung, breast and neck, and has been used in phase I and II clinical trials.59–62
Some amino acids and proteins have been considered as potential binding targets for these Cp2M(IV)Cl2. Several experimental and computational studies performed on Cp2M(IV)Cl2 with proteins including human transferrin (hTf),41,63,64 human serum albumin (HSA),19,65–66 protein kinase C (PKC),55 topoisomerase II (TOPO II)67 and ubiquitin (Ub)68, have demonstrated that interaction with proteins and amino acids is needed to be considered in the transport and/or anticancer activity of Cp2M(IV)Cl2. Proteins are important chemical substances in our lives and the main target of all drugs in the organism. Human serum transferrin (hTf) is the most abundant serum protein, and it is responsible for the transport of both endogenous and exogenous compounds. Its utilization includes storage, transport, and homeostasis of iron in vertebrates.69
More recently and using vibrational and spectroscopic techniques, some research groups have reported interactions of different drugs with DNA, RNA and proteins using UV-Vis absorption, fluorescence, synchronous fluorescence, 3D fluorescence spectra, fourier transform infrared (FTIR), circular dichroism (CD), cyclic voltammetry (CV), and nuclear magnetic resonance (NMR) at physiological pH and molecular dockingstudies.70,71 Spectroscopic studies on ligand-protein interaction are an important tool for providing crucial understanding for the design of novel anticancer drugs and to elucidate its possible modes of action and binding.72 As a result, the spectroscopic information could also be used to target potential proteins for the transport of new drugs from bloodstream to the cell, due to the molecular recognition or interaction between the protein and ligand plays an important role in many biological processes which is essential for the treatment of different diseases,73 especially using chemometric methods such as multivariate curve resolution-alternating least squares (MCR-ALS) method.74,75 These studies have also reported a mode of action where hTf can play a key role in the transport of organometallic compounds such as Cp2M(IV)Cl2 for targeting cancer cells, and the strategy on how to deliver these therapeutic agents to the target cells.76
Nevertheless, neither of the reported experimental studies has a proposed mechanism of interaction between apo-hTf and Cp2M(IV)Cl2 in order to recognize which are the dominant intermolecular forces and conformational changes playing a role in the binding of Cp2M(IV)Cl2 to apo-hTf. In an attempt to do so, Güette et al. have recently reported the binding of Cp2M(IV)Cl2 complexes to apo-hTf in silico,41 allowing to pinpoint which amino acid residues get engaged in mainly hydrophobic interactions with these metallic species. Thus, our main objective in this study is to determine the binding and thermodynamic parameters involved in interactions with seven Cp2M(IV)Cl2 complexes with apo-hTf using several spectroscopic techniques, but in conditions that may resemble the in silico studies, neither synergistic anion nor sodium chloride, only in a buffer solution. This study was performed for the current understanding of the potential mechanisms of action that organometallic compounds are employing during its binding to apo-hTf.
Materials
Tris(hydroxymethyl) aminomethane hydrochloride(Tris-HCl) and dimethyl sulfoxide (DMSO) were purchased from Fisher Scientific. Double deionized distilled water was autoclaved and used to prepare 20 mM or 2 mM Tris-HCl at pH 7.4, and PBS (137 mM NaCl, 2.7 mM KCl, 10 mM Na2HPO4, 2 mM KH2PO4, pH 7.4). Both solutions were sterilized using cellulose-acetate 0.2μm filters. All Cp2M(IV)Cl2 (M(IV) =Ti, V, Mo, Nb, Hf, Zr, W) and apo-hTf were purchased from Sigma-Aldrich and used without further purification. For spectroscopic studies, apo-hTf and Cp2M(IV)Cl2 were prepared in Tris-HCl and Tris-HCl with 2% DMSO, respectively.20 Human colorectal adenocarcinoma cell line HT-29 (ATCC HTB-38), breast cancer cell line MCF-7 (ATCC HTB-22), FBS and antibiotic/antimycotic (penicillin/streptomycin) were purchased from American Type Culture Collection (ATCC). McCoy’s 5A modified medium with 1.5 mM L-glutamine was purchased from Lonza Walkersville Inc. Minimum Essential Medium (MEM) with Eagle′s salts, 1.5 mM L-glutamine and 2.2 g/L sodium bicarbonate, bovine insulin, 0.25% trypsin-EDTA (w/v), 3-(4,5-dimethylthiazol-2-yl)-2,5-diphenyltetrazolium bromide (MTT), isopropanol and Triton-X100 were purchased from Sigma-Aldrich. HT-29 cells were grown in McCoy's 5A medium with L-glutamine supplemented with 10% (v/v) FBS and 1% (v/v) antibiotic/antimycotic.19 MCF-7 cells were grown in MEM and supplemented with 10% (v/v) FBS, 1% (v/v) antibiotic/antimycotic and 0.01 mg/mL bovine insulin.68 Both culture media were adjusted to pH 7.4 and sterilized using cellulose-acetate 0.2μm filters. For cytotoxic studies, all metallocene dichloride and apo-hTf solutions were prepared using growth media with 5% DMSO.17
MTT assay against two human cancer cell lines: HT-29 and MCF-7
MTT assays were performed to determine cytotoxicity of Cp2M(IV)Cl2 on two different cell lines obtained from American Type Culture Collection (ATCC): human colorectal adenocarcinoma cell line, HT-29 (ATCC HTB-38) and human breast adenocarcinoma cell line, MCF-7 (ATCC HTB-22). HT-29 cells were cultured into T25 flasks containing McCoy's 5A modified medium with 1.5 mM L-glutamine, and supplemented with 10% (v/v) fetal bovine serum and 1% (v/v) antibiotic-antimycotic. MCF-7 cells were also cultured into T25s flask containing Minimum essential Eagle medium with Earle′s salts, 1.5 mM L-glutamine and 2.2 g/L sodium bicarbonate, and supplemented with 10% (v/v) fetal bovine serum, 1% (v/v) antibiotic-antimycotic and 0.01 mg/mL bovine insulin. Both cancer cell lines were incubated at 37°C under an atmosphere of 5% CO2/95% air.19 Culture media was replaced every 24-72 h to maintain optimum culture conditions. Once the cells have reached 70-80% confluency, the media was removed, the cells were washed with phosphate buffered saline (PBS) and trypsinized with 1 mL of 0.25% (w/v) trypsin-EDTA, and incubated briefly at 37°C to ensure complete cell detachment. Subsequently, cells were resuspended in fresh media, counted using a hemocytometer and 100mL of re suspended cells were seeded at a density of 1.5×10⁴ cells/well into 96-well tissue culture plates, and incubated for 24 h under an atmosphere of 5% CO2/95% air at 37°C, prior to Cp2M(IV)Cl2 treatment.17
After 24 h, grown cells were treated with 25μL of different concentrations of Cp2M(IV)Cl2 dissolved in 5% DMSO/95% culture media per well, either in the presence or absence of apo-hTf. Positive and negative control tests were performed in the presence and absence of cells contained 5% DMSO/95% culture media, respectively.20 After treatment with Cp2M(IV)Cl2 for 72 h at 37°C and under an atmosphere of 5% CO2/95% air, an aliquot of 75μL of 2.67 mg/mL MTT dissolved in culture media was added to each well and further incubated for 2 h to carry out the reduction of MTT into a purple water-insoluble formazan by mitochondrial succinate dehydrogenase.The MTT-contained media was removed and, subsequently, the cells were briefly rinsed with 200μL of cold 1X PBS. Formazan crystals were dissolved with 200μL of 10% (v/v) Triton X-100 solution in isopropanol and the absorbance readings were measured at 570 nm with a background subtraction at 620 nm in an ATTC Microplate Reader at room temperature.68 The median inhibitory concentration (IC50) was calculated using a sigmoidal plotting performed in the GraphPad Prism 3.0 software. Each assay contains eight replicas and was performed in triplicates.77
Spectroscopic analysis
UV-Vis absorbance
Absorbance spectra of apo-hTf, Cp2M(IV)Cl2 and apo-hTf:Cp2M(IV)Cl2 complexes were recorded in a Varian Cary 50 Bio UV-Vis spectrophotometer over a wavelength range from 250 nm to 560 nm using a 1.0 cm quartz cuvette. One milliliter of 1.0×10⁻⁵ mol L–1 apo-hTf dissolved in 20 mM Tris-HCl buffer at pH 7.4 was titrated with different amounts of 1.0×10⁻³ mol L–1 Cp2M(IV)Cl2 (5, 10, 15, 20, 25, 30, 40, 50, 75, 100, 125, 150, 175, 200, 250, 300, 350 and 400 mL) to analyze changes in absorbance readings while formation of the ligand-protein complexes. The final concentration of Cp2M(IV)Cl2 varied from 0.00 mol L-1 to 2.86×10⁻⁴ mol L-1. A difference spectra was generated for each aliquot of Cp2M(IV)Cl2 added to apo-hTf and after subtraction of the baseline with 20 mM Tris-HCl buffer at pH 7.4, either alone or with equal amount of DMSO at room temperature.78
Fluorescence spectroscopy
Fluorescence spectra of apo-hTf and apo-hTf:Cp2M(IV)Cl2 complexes were recorded in a Shimadzu RF-5301 PC spectrofluorophotometer equipped with a 150 W xenon lamp and temperature controller. All apo-hTf:Cp2M(IV)Cl2 complexes were prepared in a 1.0 cm quartz cuvette and analyzed using an emission wavelength range from 290 nm to 500 nm, excitation wavelength of 280 nm, excitation width of 10 nm and emission width of 5 nm. The emission spectra were also recorded at 296 K, 303 K, 310 K and 317 K to observe the stability of complex formation with changes in temperature. The quantitative analysis was performed by fluorometric titration. One milliliter of 1.0×10⁻⁵ mol L–1 apo-hTf in 20 mM Tris-HCl buffer at pH 7.4 was titrated with different amounts of 1.0×10⁻³ mol L–1 Cp2M(IV)Cl2 (5, 10, 15, 20, 25, 50, 75, 100, 125, 150, 175, 200, 250, 300, 350 and 400 mL) and at the different temperatures. All titrations were performed in triplicate.65 Fluorescence intensities of the quenching spectra were corrected on absorbances at the excitation and emission wavelengths to decrease the inner filter effect, according to the following equation:
where Fcorand Fobs are the corrected and observed fluorescence intensity, respectively, and Aex and Aem are the absorbances at the excitation and emission wavelengths of Cp2M(IV)Cl2, respectively.79
Circular
Dichroism
Circular dichroism (CD) was used to find changes in the secondary structure of apo-hTf upon interaction with Cp2M(IV)Cl2 using far-UV (from 190 nm to 250 nm) and near-UV (from 250 nm to 300 nm) regions. CD spectra were carried out on a Jasco J-815 CD spectropolarimeter, equipped with a xenon lamp monochromatic linearly polarized. All CD measurements were done under a constant Nitrogen flow and using a 1.0 cm quartz cuvette. (+)-10-Camphorsulfonic acid was used for calibration of the spectropolarimeter following the manufacturer instructions. Six scans were accumulated and the spectral data was recorded in the range from 190 nm to 300 nm, with a scan speed of 100 nm/min. A volume of 2.5 mL of 4.0×10⁻⁷ mol L–1 apo-hTf in 2 mM Tris-HCl buffer at pH 7.4 was titrated with different amounts of 1.0×10⁻³ mol L–1 Cp2M(IV)Cl2 (0, 1, 2, 3, 4, 5 and 6 mL). The final concentration of Cp2M(IV)Cl2 varied from 0.0 mol L−1 to 2.4×10⁻⁶ mol L−1. The baseline was run using 2 mM Tris-HCl buffer at pH 7.4, either alone or with equal amount of DMSO at room temperature.68
Data analysis
All the results were expressed as means ± standard deviation (SD). The cytotoxicity of metallocene dichlorides against MCF-7 and HT-29 was expressed as IC50±SD and determined using GraphPad Prism, while cell viability vs log [Cp2M(IV)Cl2] plot was fitted to obtained the sigmoidal dose-response curves. UV-Vis absorption (at 280 nm and 360 nm) and fluorescence intensity (at 330 nm) data were plotted against [Cp2M(IV)Cl2] using linear regression analysis, and coefficient of determination (R2) were reported as statistical measure that indicates the linear relationship between the evaluated variables. Binding constants and thermodynamic parameters were determined using different linear regression fit.
Cytotoxicity studies of metallocene dichlorides against MCF-7 and HT-29
The antiproliferative activity of the metallocene dichlorideswas determined on colon cancer HT-29 and the hormone-dependent breast cancer MCF-7cell lines using the 3-(4,5-dimethylthiazol-2-yl)-2,5-diphenyltetrazolium bromide (MTT) cell viability assay, after a 72 h exposure.80,81 Control experiments were run in 100% media and 5% DMSO/95% media. Both control experiments behaved identically within the experimental error, thus demonstrating that 5% DMSO in culture media does not have any cytotoxic effect on these cell lines, as reported previously.17 Cytotoxicity values, expressed as IC50 for each Cp2M(IV)Cl2 against MCF-7 and HT-29,are summarized in Table 1 and their dose-response curves are shown in Figure 2. IC50 values were calculated using culture media as a control. Cp2VCl2 and Cp2NbCl2 exhibited antiproliferative effect on MCF-7 with an IC50 of 0.050 (±0.007) mM and 1.301 (±0.035) mM, respectively. Meanwhile, Cp2HfCl2 and Cp2ZrCl2 exhibited proliferative activity on MCF-7. Previous studies performed by Meléndez’s group reported the antiproliferative activity of Cp2TiCl2 and Cp2WCl2 on MCF-7 with an IC50 of 0.570 (±0.005) mM82 and 0.630 (±0.010) mM,19 respectively. However, Cp2MoCl2 exhibited proliferative activity.21,68 For the colon cancer HT-29 cell line, our cytotoxic data suggests that all Cp2M(IV)Cl2 have antiproliferative activity with an IC50 of 0.033 (±0.001) mM, 0.266 (±0.035) mM, 0.564 (±0.010) mM, and 0.774 (±0.020) mM for Cp2VCl2, Cp2NbCl2, Cp2HfCl2 and Cp2ZrCl2, respectively. Previous studies performed by Meléndez’s group have also reported the antiproliferative activity of Cp2TiCl2, Cp2WCl2, Cp2MoCl2, and (NH3)2Pt(II)Cl2on HT-29, with IC50 values of 0.413 (±0.002) mM,82 1.000 (±0.100) mM,19 2.600 (±0.300) mM,21 and 0.066 (±0.002) mM,77 respectively.

Figure 2 Dose-response curves of four metallocene dichlorides after their exposure for 72 h on two human breast cancer MCF-7 (A) and colon cancer HT-29 (B) cell lines.
|
Compound |
IC50 (±SD), mM |
|
|
|
MCF-7 |
HT-29 |
|
Cp2VCl2 |
0.050 (±0.007) |
0.033 (±0.001) |
|
Cp2NbCl2 |
1.301 (±0.035) |
0.266 (±0.035) |
|
Cp2HfCl2 |
Proliferative |
0.564 (±0.010) |
|
Cp2ZrCl2 |
Proliferative |
0.774 (±0.020) |
|
Cp2TiCl2 |
0.570 (±0.005)82 |
0.413 (±0.002)82 |
|
Cp2WCl2 |
0.630 (±0.010)19 |
1.000 (±0.100)19 |
|
Cp2MoCl2 |
2.600 (±0.300)21 |
|
|
(NH3)2PtCl2 (CDDP) |
NR* |
0.066 (±0.002)77 |
|
(NH3)2PtCl2 (CDDP) |
0.0020 (±0.0003)83 |
0.076 (±0.005)85 |
|
|
0.0046 (±NR)84 |
0.023 (±NR)84 |
Table 1 Antiproliferative activities of seven Cp2M(IV)Cl2 and CDDP on human breast cancer MCF-7 and human colon cancer HT-29 cell lines, after 72 h of exposure. All experiments were performed in triplicate
* NR = not reported.
Our recent cytotoxic studies suggest that HT-29 cells are more sensitive than MCF-7 cells when exposed to these metallocene dichlorides, with the exception ofCp2WCl2 and the standard chemodrug cisplatin ((NH3)2Pt(II)Cl2). The results also suggest that after 72 h of exposure, Cp2VCl2 has more cytotoxic activity on both cancer cell lines. However, based on the cytotoxic studies performed by Schafer et al.,83 and Mizumura et al.,84 on MCF-7 cells, (NH3)2Pt(II)Cl2 has an IC50 of 0.0020 mM and 0.0046 mM, respectively. Thus, (NH3)2Pt(II)Cl2 is one order of magnitude more cytotoxic than Cp2VCl2. Otherwise, Cp2VCl2 has shown to be more cytotoxic on HT-29 cells than (NH3)2Pt(II)Cl2, as shown by Narváez-Pita et al.,77 and Leong et al.,85 where an IC50 of 0.066 (±0.002) mM and 0.076 (±0.005) mM were reported, respectively. However, as seen in the Table 1, Cp2VCl2 has a level of cytotoxic activity similar to (NH3)2Pt(II)Cl2 in agreement with the results reported by Mizumura et al.84
In summary, Cp2VCl2, Cp2TiCl2, Cp2WCl2, and Cp2NbCl2 have moderate to low anti-proliferative activity on MCF-7 cells (IC50 from 1.301 nm to 0.050 mM), but Cp2HfCl2, Cp2ZrCl2, and Cp2MoCl2 have no activity under similar experimental conditions. Meanwhile, Cp2VCl2 have a high antiproliferative activity, and Cp2NbCl2, Cp2HfCl2, Cp2ZrCl2, Cp2TiCl2, Cp2WCl2 and Cp2MoCl2 have moderate to very low antiproliferative activity on HT-29 cells (IC50 from 2.600 mM to 0.266 mM). Based on recent studies conducted by Meléndez’s group, these results correlate well in terms of the solubility, aqueous stability and redox behavior of the Cp2M(IV)Cl2, suggesting that some metallocene dichlorides are quite stable at physiological pH whereas others can decompose in 3 h or less.19,86 The aqueous stability of these metallocene dichlorides varies according to their Lewis acid character. Cp2VCl2 decomposes into Cp2V(OH)2, Cp2NbCl2 oxidizes to Cp2NbClOH, and Cp2MoCl2 decomposes into Cp2Mo(H2O)(OH)+ at physiological pH, meanwhile others such as Cp2M(IV)Cl2, M(IV)=Ti, Zr and Hf, undergo chloride loss and Cp pronoloysis, being Ti the most stable of the triad.87,88 In addition, the oxidation potential can play an important role in the cytotoxic activity, because those metallocene dichlorides with higher oxidation potential are more stable to oxidation than those with low oxidation potential.86 For example, the oxidation potential of Cp2MoCl2 is higher than of Cp2WCl2, suggesting that Cp2MoCl2 is less prone to oxidation than the tungstenocene counterpart. However, Cp2WCl2 has higher antiproliferative activity than Cp2MoCl2 on both MCF-7 and HT-29 cells.19,86 The antiproliferative activity of these metallocene dichlorides also correlated well with the role played by the metal center and Cl–M–Cl angle with regard to the biological activity. Other studies have also concluded that the mechanism of tumor inhibition for the antineoplastic active and non-active metallocene dichlorides is inversely related to both an increased Cl…Cl non-bonding distance and Cl–M–Cl bond angle that may foreseeing the cancerostatic activity of these compounds.41,89
UV-Vis spectroscopy
UV-Vis spectroscopy is a simple, useful and relevant method used to explore the formation of protein-ligand complexes and to determine if protein conformational changes have occurred.90,91 The absorption spectra of a protein can support fluorescence quenching experiments after a careful examination of the type of perturbation this protein is undergoing in the presence of ligands (or compounds). Dynamic quenching is mainly caused by collisions and affects only the excited state of the fluorophore and, therefore, no changes in absorption spectra are expected. Otherwise, a complex formation could also result in perturbation of the protein’s absorption spectrum, thus suggesting a static quenching effect.80,92 The binding effect of five Cp2M(IV)Cl2(M(IV)=V, Mo, W, Nb,and Ti) with apo-hTf was investigated using UV-Vis spectroscopy due to their promising antitumor activities. Figures 3&4 (as well as Figure S1 for Cp2ZrCl2, Cp2HfCl2 and (NH3)2Pt(II)Cl2) show the effect caused by these compounds on the absorption spectra apo-hTf when assays were run at physiological pH and room temperature.
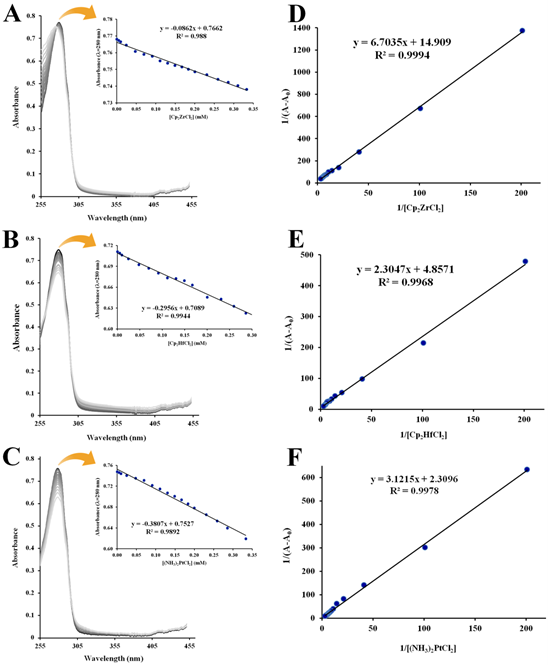
Figure S1 UV-Vis absorption spectra (T=298 K, pH=7.4) of 1.0×10⁻⁵ M apo-hTf in the presence of Cp2ZrCl2 (A), Cp2HfCl2 (B) and (NH3)2Pt(II)Cl2 (C). The insets shows linear plot of absorbance vs [Cp2M(IV)Cl2] (or [(NH3)2Pt(II)Cl2]) generated at 280 nm. Double reciprocal plots (1/(A–A0) vs 1/[Cp2M(IV)Cl2] or 1/[(NH3)2Pt(II)Cl2]) of the Benesi and Hildebrand equation for Cp2ZrCl2 (D), Cp2HfCl2 (E) and (NH3)2Pt(II)Cl2 (F) were generated at280 nm.
The absorption spectra of apo-hTf exhibited a strong absorption band at 280 nm characteristic of the π→π* transition of the aromatic amino acid residues Trp, Tyr and Phe.93 This band at 280 nm increases as the concentration of Cp2M(IV)Cl2 (M(IV) =V, Mo, W, Nb and Ti) increases as shown in Figures 3A, 3B, 3C, 4A and 4B, respectively. In addition to this hyperchromic effect, a slight red shift was also observed. These spectral changes might suggest that an interaction between apo-hTf and these metallocene dichlorides has occurred through a static quenching. A change in λmax might be due to loosening and unfolding of the protein backbone. As a result, more changes in polarity around the Trp and/or Tyr microenvironment could occur due to changes in the secondary structure of apo-hTf and, hence, changes in hydrophobicity around these aromatic residues.94,95 However, when Cp2VCl2, Cp2MoCl2, and Cp2WCl2 were added to apo-hTf, a broad new band appeared immediately at 361 nm and its intensity also increased with increasing amounts of these three compounds (Figures 3A,3B,3C, respectively). An equal effect was also observed with Cp2TiCl2, but the broadband appeared immediately around 340 nm (Figure 4B). This new band is similar to those observed for ligand to metal charge transfer (LMCT) transitions of metal(IV) with phenolate residues, and suggest to be attributed to the LMCT transition of MIV with phenolate residues.63 On the other hand, when Cp2HfCl2, Cp2ZrCl2 and (NH3)2Pt(II)Cl2 were added to apo-hTf, the absorption band at 280 nm decreases with increasing concentration of these compounds, as can be seen in Figures S1A, S1B, and S1C, respectively. The results suggest a poor interaction between apo-hTf and these three compounds. The observed changes in absorbance readings of apo-hTf (in the presence of different concentrations of metallocene dichlorides) could suggest the occurrence of dynamic quenching interaction between Cp2HfCl2(or Cp2ZrCl2 or (NH3)2Pt(II)Cl2) and apo-hTf.80
The association constant (Ka) of each protein-ligand adduct could be determined by assuming that the interaction between a protein and its ligand occurs via a single complex and at a 1:1 ratio. For apo-hTf, the single complex formation could be shown as follows:
apo-hTf + Cp2M(IV)Cl2 apo-hTf:Cp2M(IV)Cl2
It is also assumed that the Beer’s law is followed,according to the following equation:
where A0 and A are the absorption of apo-hTf in the absence and presence of Cp2M(IV)Cl2, respectively, and A¥ is the final absorption of the ligated apo-hTf.96 According to Stephanos et al. all these three variables could be obtained from the absorption data at 280 nm and 361 nm.97
The equilibrium of complex formation between apo-hTf and the metallocene dichlorides under study is given by the double reciprocal Benesi and Hildebrand equation.96 Thus, Ka can be calculated from the intercept to the slope ratio of the linear double reciprocal plot of 1/(A–A0)versus 1/[Cp2M(IV)Cl2] based on the following equation:
Figures 3, 4 and S2 show the linear double reciprocal plots of 1/(A–A0) vs 1/[Cp2M(IV)Cl2]. In summary, Ka was obtained for all metallocene dichlorides at 280 nm, but at 361 nm, it was only obtained for Cp2VCl2, Cp2MoCl2 and Cp2WCl2 (Table 2). At 280 nm, the Ka for Cp2VCl2 (Figure 3D), Cp2MoCl2 (Figure 3E) and Cp2WCl2 (Figure 3F) was 3.24×10³ M–1, 3.06×10³ M–1 and 2.93×10³ M–1, respectively. Meanwhile at 361 nm, their Ka was 2.67×10³ M–1, 3.09×10³ M–1 and 2.98×10³ M–1, respectively. For Cp2NbCl2 (Figure 4C) and Cp2TiCl2 (Figure 4D), the Ka(at 280 nm) was 3.00×10³ M–1 and 2.89×10³ M–1, respectively. In addition, Cp2ZrCl2 (Figure S2A), Cp2HfCl2 (Figure S2B) and (NH3)2Pt(II)Cl2 (Figure S2C) have a Ka (at 280 nm) of 2.22×10³ M–1, 2.11×10³ M–1 and 7.4×10² M–1, respectively. In general, all these Ka were found moderately large, in an order of magnitude of 103. However, the Ka for (NH3)2Pt(II)Cl2 was considerably small, in an order of magnitude of 102.
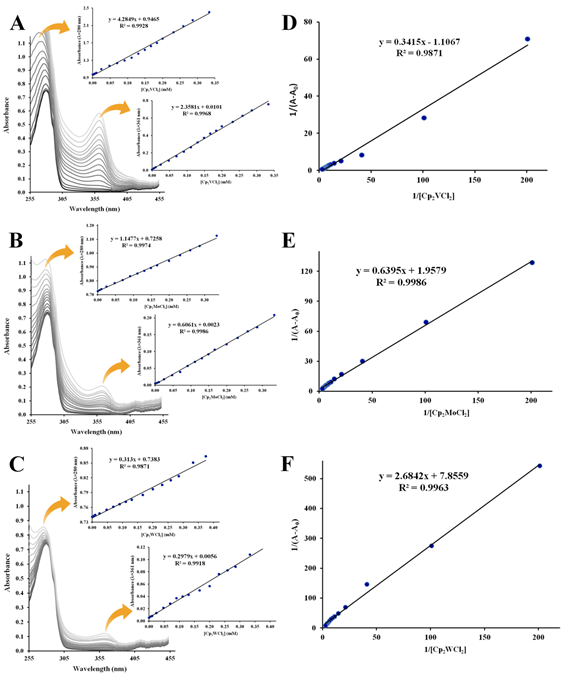
Figure 3 UV-Vis absorption spectra (T=298 K, pH=7.4) of 1.0×10⁻⁵ M apo-hTf in the presence of Cp2VCl2 (A), Cp2MoCl2 (B) and Cp2WCl2 (C). The insets show linear plot of absorbance vs [Cp2M(IV)Cl2] generated at 280 nm and 361 nm. Double reciprocal plots (1/(A–A0) vs 1/[Cp2M(IV)Cl2]) of the Benesi and Hildebrand equation for Cp2VCl2 (D), Cp2MoCl2 (E) and Cp2WCl2 (F) were generated at280 nm.

Figure S2 Double reciprocal plots (1/(A–A0) vs 1/[Cp2M(IV)Cl2]) of the Benesi and Hildebrand equation for Cp2VCl2 (A), Cp2MoCl2 (B) and Cp2WCl2 (C) were generated at361 nm.
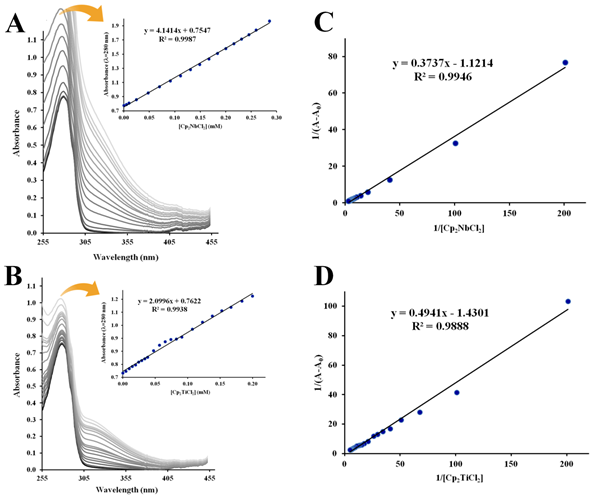
Figure 4 UV-Vis absorption spectra (T=298 K, pH=7.4) of 1.0×10⁻⁵ M apo-hTf in the presence of Cp2NbCl2 (A) and Cp2TiCl2 (B). The inset shows linear plot of absorbance vs [Cp2M(IV)Cl2] at 280 nm. Double reciprocals plots (1/(A–A0) vs 1/[ Cp2M(IV)Cl2]) of the Benesi and Hildebrand equation for Cp2NbCl2 (C) and Cp2TiCl2 (D) were generated at280 nm.
|
Compound |
Association constants, Ka (103) (M–1) |
|
|
|
280 nm |
361 nm |
|
Cp2VCl2 |
3.24 |
2.67 |
|
Cp2MoCl2 |
3.06 |
3.09 |
|
Cp2WCl2 |
2.93 |
2.98 |
|
Cp2NbCl2 |
3 |
– |
|
Cp2TiCl2 |
2.89 |
– |
|
Cp2ZrCl2 |
2.22 |
– |
|
Cp2HfCl2 |
2.11 |
– |
|
(NH3)2Pt(II)Cl2 |
0.74 |
– |
Table 2 The association constants (Ka) of seven Cp2M(IV)Cl2 and DCCP,determined from calculations using the absorbance readings of apo-hTf at 280 nm and 361 nm
Fluorescence spectroscopy
Fluorescence spectroscopy is one of the most convenient and successful methods applied for the study of ligand-protein interactions. For biomacromolecules, fluorescence measurements provide information on ligand-protein interactions such as quenching mechanism, binding affinity between the ligand and protein for calculating binding constants, binding site for the ligand on a protein, nature of binding force for determining thermodynamic parameters and the intermolecular distance between the ligand and protein molecule.90 Thus, the intrinsic fluorescence of proteins can provide considerable information regarding their structure and dynamics, and is often considered in the study of protein folding and association reactions. Consideration should also be taken to the fact that the intrinsic fluorescence of apo-hTf is very sensitive to its microenvironment. The intensity of the fluorescence of a substance can be affected or influenced by many factors, such as molecular rearrangements, collisions, complex formation, and energy transfer between two or more species, leading to what is called a fluorescence quenching spectrum.96
Fluorescence quenching studies of apo-hTf by seven Cp2M(IV)Cl2
When local surroundings of apo-hTf are slightly altered, its intrinsic fluorescence became significantly weakened, and factors such as protein conformational transition and biomolecule binding, among others, are responsible for this weakening. The fluorescence of apo-hTf emerges from its tryptophan, tyrosine, and phenylalanine residues.98 Actually, the intrinsic fluorescence of apo-hTf came (almost completely) from tryptophan only, since phenylalanine has a very low quantum yield and the fluorescence of tyrosine is almost totally quenched if it is ionized or near an amino group, a carboxyl group, or even a tryptophan residue. This viewpoint was supported by the experimental observation of Sulkowska.99 When a small molecule is bound to apo-hTf, changes in its intrinsic fluorescence intensity were induced by the microenvironment of the Trp/Tyr residues. The participation of tyrosine and tryptophan groups in those apo-hTf:Cp2M(IV)Cl2 complexes was assessed based on different excitation wavelengths. At a wavelength of 280 nm, both the tryptophanyl and tyrosyl residues in apo-hTf became excited.98
Quenching mechanism analysis
The quenching mechanism induced by the seven metallocene dichlorides was evaluated by temperature dependency of the fluorescence quenching, and their data were analyzed using the Stern-Volmer equation.80
where F0 and F are the steady-state fluorescence intensities of apo-hTf in the absence and presence of the quencher (Cp2M(IV)Cl2), respectively, [Q] is the concentration of the quencher, kqis the biomolecular quenching rate constant, is the average lifetime for biopolymer in the absence of the quencher, which is of the order of 1.0×10⁻⁸ s-1 for proteins, and Ksv is the Stern-Volmer quenching constant.80 The quenching constant can be calculated using the following equation:
Figures 5–7 and Figures S3–S7 show the fluorescence quenching spectra of apo-hTf after addition of different amounts of each metallocene dichloride and of (NH3)2Pt(II)Cl2. The emission spectrum of apo-hTf, under the applied conditions, did show one emission band at 330 nm. In all cases, a decrease in the intensity of the emission band at 330 nm was observed with addition of the quencher. The results also suggest that the quenching effect on apo-hTf fluorescence intensity is dependent on the concentration of the ligand. For example, Cp2VCl2 and Cp2NbCl2 show a strong quenching effect on the apo-hTf intrinsic fluorescence intensity. Meanwhile, other Cp2M(IV)Cl2 (M(IV) =Mo, W, Ti, Zr, Hf), and even (NH3)2Pt(II)Cl2, exhibits a moderate quenching effect on the apo-hTf intrinsic fluorescence intensity at both maximum emission wavelengths. All metallocene dichloridesalso induced a slight red shift of the emission band at 330 nm. The strong or moderate quenching and the slight red shift suggest that the microenvironment around both, tryptophanyl and tyrosyl residues, is changing as an indication that a molecular interaction have occurred and that an apo-hTf:Cp2M(IV)Cl2 complex has been formed.96

Figure 5 Fluorescence quenching of apo-hTf emission spectra with increasing amounts of Cp2VCl2 at296 K (A), 303 K (B), 310 K (C) and 317 K (D). A progressive decrease in the fluorescence intensity and a remarkable red shift was observed with addition of Cp2VCl2. The protein apo-hTf was excited at 280 nm, and its emission spectra was recorded in the range of 290 nm to 500 nm. Inset: Stern-Volmer plots of F0/F versus [Q].
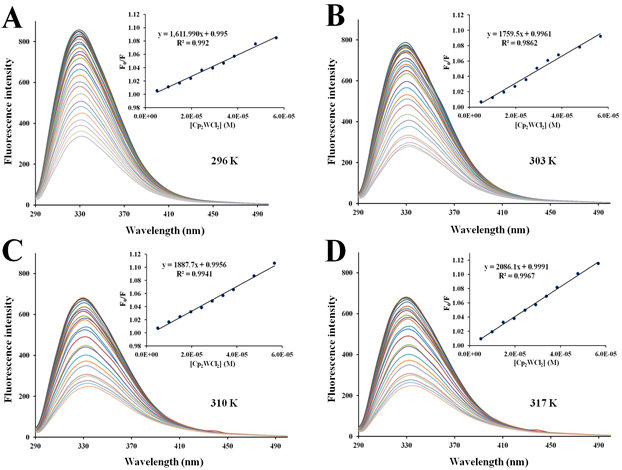
Figure S3 Fluorescence quenching emission spectra of apo-hTf with increasing amounts of Cp2WCl2 at296 K (A), 303 K (B), 310 K (C) and 317 K (D). A progressive decrease in the fluorescence intensity and remarkable red shift was observed while successive addition Cp2WCl2. The protein apo-hTf was excited at 280 nm and its emission spectra was recorded in the range of 290 nm to 500 nm. Inset: Stern-Volmer plots of F0/F versus [Q].
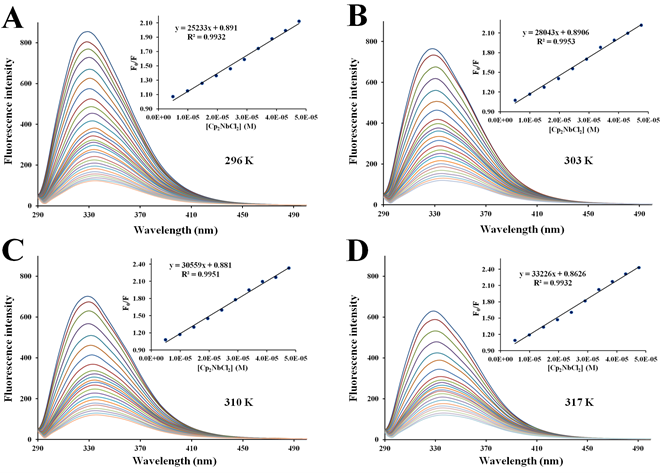
Figure 6 Fluorescence quenching of apo-hTf emission spectra with increasing amounts of Cp2VCl2 at296 K (A), 303 K (B), 310 K (C) and 317 K (D). A progressive decrease in the fluorescence intensity and a remarkable red shift was observed with addition of Cp2VCl2. The protein apo-hTf was excited at 280 nm, and its emission spectra was recorded in the range of 290 nm to 500 nm. Inset: Stern-Volmer plots of F0/F versus [Q].
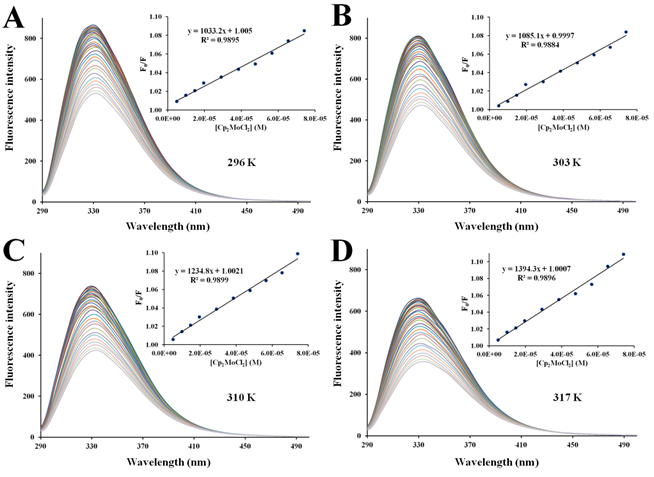
Figure 7 Fluorescence quenching of apo-hTf emission spectra with increasing amounts of Cp2MoCl2 at296 K (A), 303 K (B), 310 K (C) and 317 K (D). A progressive decrease in the fluorescence intensity and a remarkable red shift was observed with addition of Cp2MoCl2. The protein apo-hTf was excited at 280 nm, and its emission spectra was recorded in the range of 290 nm to 500 nm. Inset: Stern-Volmer plots of F0/F versus [Q].
There are two different types of fluorescence quenching mechanisms known as dynamic and static quenching, depending on how the quencher molecule is interacting with the protein. Dynamic quenching depends on the diffusion of a quencher toward a fluorophore; therefore, they are in contact only through collision between fluorescent molecules and the quencher during the lifetime of the excited state. Static quenching is related to the formation of the complex and binding interactions between the fluorophore and quencher. One way to determine the quenching mechanism is by examining the behavior of the fluorophore in the presence of the quencher at different temperatures.91 For that purpose, the fluorescence quenching spectra of apo-hTf were obtained at four different temperatures, and to elucidate a possible mechanism responsible for the quenching of the apo-hTf intrinsic fluorescence intensity, the Stern-Volmer equation was used for data analysis. Plots of F0/F versus [Q] are shown in Figures 5–7 and Figures S3–S7. Moreover, these plots exhibited fairly good linear relationships (R> 0.970) suggesting that a single quenching phenomenon, either static or dynamic quenching, have occurred during the formation of each apo-hTf:Cp2M(IV)Cl2 complex.92 The slopes obtained from these plots correspond to the Stern-Volmer quenching constants (Ksv) and are summarized in Table 3. The dynamic quenching depends upon diffusion; hence, their quenching constants increase when the temperature increases. On the other hand, the static quenching is characterized by a decrease in their quenching constants as the temperature increases, thus promoting a decrease in the stability of the apo-hTf:Cp2M(IV)Cl2 complex. Another criterion used to classify the static quenching is kq; a static quenching is observed when kq is larger than the limiting diffusion collision quenching constant, KD, of a biomolecule against different quenchers (2.0×10¹⁰ M-1s-1).93
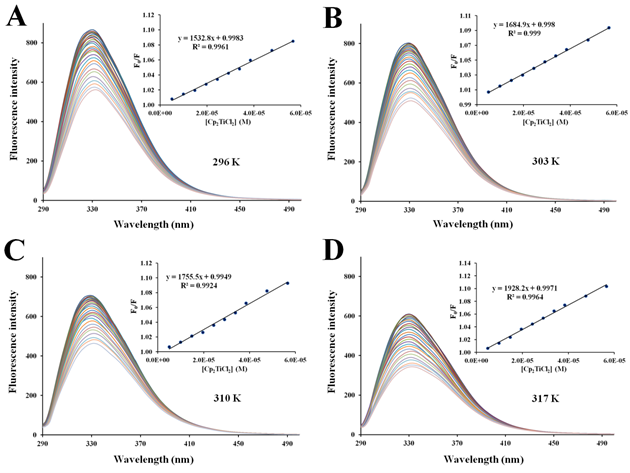
Figure S4 Fluorescence quenching of apo-hTf emission spectra with increasing amounts of Cp2TiCl2 at296 K (A), 303 K (B), 310 K (C) and 317 K (D). A progressive decrease in the fluorescence intensity and a remarkable red shift was observed with addition of Cp2TiCl2. The protein apo-hTf was excited at 280 nm and its emission spectra was recorded in the range of 290 nm to 500 nm. Inset: Stern-Volmer plots of F0/F versus [Q].

Figure S5 Fluorescence quenching emission spectra of apo-hTf with increasing amounts of Cp2ZrCl2 at 296 K (A), 303 K (B), 310 K (C) and 317 K (D). A progressive decrease in the fluorescence intensity and a remarkable red shift was observed with addition of Cp2ZrCl2. The protein apo-hTf was excited at 280 nm, and its emission spectra was recorded in the range of 290 nm to 500 nm. Inset: Stern-Volmer plots of F0/F versus [Q].
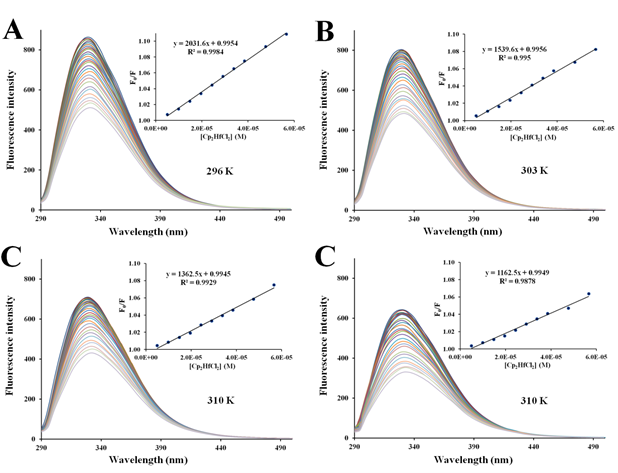
Figure S6 Fluorescence quenching emission spectra of apo-hTf with increasing amounts of Cp2HfCl2 at 296 K (A), 303 K (B), 310 K (C) and 317 K (D). A progressive decrease in the fluorescence intensity and a remarkable red shift was observed with addition of Cp2HfCl2. The protein apo-hTf was excited at 280 nm, and its emission spectra was recorded in the range of 290 nm to 500 nm. Inset: Stern-Volmer plots of F0/F versus [Q].
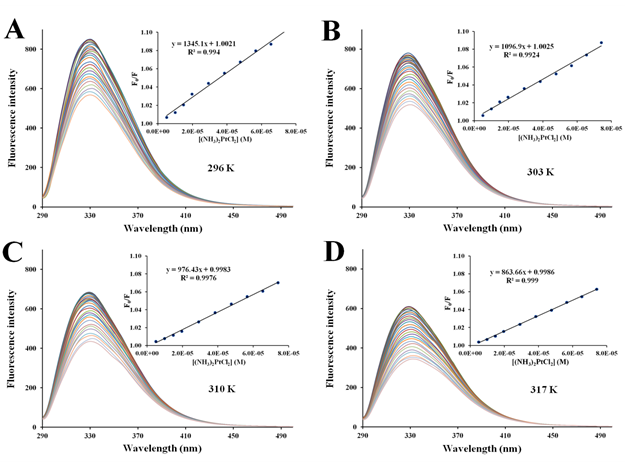
Figure S7 Fluorescence quenching emission spectra of apo-hTf with continuous addition of (NH3)2Pt(II)Cl2 at296 K (A), 303 K (B), 310 K (C), and 317 K (D). A progressive decrease in fluorescence intensity and a remarkable red shift was observed with the addition of (NH3)2Pt(II)Cl2. The protein was excited at 280 nm, and its emission spectra were recorded from 290 nm to 500 nm. Inset: Stern-Volmer plot of F0/F versus [Q].
|
Compound |
Temperature (K) |
Ksv(×104) (M-1) |
kq(×1011) (M-1s-1) |
n |
Ka(×104)(M-1) |
|
Cp2VCl2 |
296 |
3.564 |
35.64 |
1.23 |
44.44 |
|
303 |
4.085 |
40.85 |
1.2 |
33.75 |
|
|
310 |
4.26 |
42.6 |
1.16 |
24.05 |
|
|
317 |
4.936 |
49.36 |
1.11 |
15.98 |
|
|
Cp2NbCl2 |
296 |
2.523 |
25.23 |
1.26 |
32.53 |
|
303 |
2.804 |
28.04 |
1.27 |
40.81 |
|
|
310 |
3.056 |
30.56 |
1.28 |
48.55 |
|
|
317 |
3.323 |
33.23 |
1.29 |
56.23 |
|
|
Cp2MoCl2 |
296 |
0.151 |
1.51 |
1.26 |
1.93 |
|
303 |
0.159 |
1.59 |
1.23 |
1.58 |
|
|
310 |
0.181 |
1.81 |
1.19 |
1.21 |
|
|
317 |
0.205 |
2.05 |
1.16 |
0.95 |
|
|
Cp2WCl2 |
296 |
0.161 |
1.61 |
1.16 |
0.78 |
|
303 |
0.176 |
1.76 |
1.13 |
0.6 |
|
|
310 |
0.189 |
1.89 |
1.08 |
0.42 |
|
|
317 |
0.209 |
2.09 |
1.04 |
0.32 |
|
|
Cp2TiCl2 |
296 |
0.153 |
1.53 |
1.11 |
0.45 |
|
303 |
0.168 |
1.68 |
1.09 |
0.41 |
|
|
310 |
0.176 |
1.76 |
1.07 |
0.36 |
|
|
317 |
0.193 |
1.93 |
1.05 |
0.31 |
|
|
Cp2ZrCl2 |
296 |
0.239 |
2.39 |
1.07 |
0.44 |
|
303 |
0.197 |
1.97 |
1.03 |
0.26 |
|
|
310 |
0.179 |
1.79 |
1.01 |
0.2 |
|
|
317 |
0.15 |
1.5 |
1 |
0.16 |
|
|
Cp2HfCl2 |
296 |
0.197 |
1.97 |
1.15 |
0.89 |
|
303 |
0.157 |
1.57 |
1.17 |
0.81 |
|
|
310 |
0.136 |
1.36 |
1.18 |
0.75 |
|
|
317 |
0.124 |
1.24 |
1.19 |
0.7 |
|
|
(NH3)2Pt(II)Cl2 |
296 |
0.135 |
1.35 |
0.97 |
0.11 |
|
303 |
0.11 |
1.1 |
1.01 |
0.12 |
|
|
310 |
0.098 |
0.98 |
1.04 |
0.14 |
|
|
|
317 |
0.086 |
0.86 |
1.07 |
0.16 |
Table 3 Stern-Volmer quenching constants Ksv and kq, and the binding parameters n and Ka, for each apo-hTf: Cp2M(IV)Cl2complex formed at four different temperatures
Table 3 also shows the biomolecular quenching rate constant (kq) for each apo-hTf:Cp2M(IV)Cl2 complex, obtained from the fluorescence quenching spectra at different temperatures. As shown in Table 3, all kq were larger than KD, independent of the apo-hTf:Cp2M(IV)Cl2 complex and, by following the maximum scatter collision mechanism, the static quenching process is mainly favorable. Furthermore, the Ksv and kq of Cp2VCl2 and Cp2NbCl2 were at least one order of magnitude larger than for other Cp2M(IV)Cl2 (M(IV) = Mo, W, Ti, Zr and Hf). All Ksv and kq were temperature dependent. For example, the trend observed for Ksv and kq was to increase as the temperature increases when Cp2M(IV)Cl2 (M(IV) = V, Nb, Mo, W and Ti), thus suggesting a dynamic quenching process, but for Cp2ZrCl2,Cp2HfCl2and (NH3)2Pt(II)Cl2 the trend observed was to decrease as the temperature increases, thus suggesting a static quenching process (complex formation). These contradictory results raise the question about what type of interactions these metallocene dichlorides are really engaged with apo-hTf. At this point, we can only speculate that the apo-hTf:Cp2M(IV)Cl2 interaction is weak and labile, and prompted us to further use the fluorescence quenching spectra and Ksv to calculate their corresponding thermodynamic parameters.19,68
Similar values of Ksv and kq were also reported by Du et al. (Ksv = 3.0×10⁴ M–1 and kq = 3.0×10¹² M–1s–1)63 and Zhang et al. (Ksv = 3.04×10⁴ M–1 and kq = 3.04×10¹² M–1s–1)64 for the apo-hTf:Cp2VCl2 complex, respectively. Both authors have concluded that the fluorescence quenching is a static quenching process. In addition, other studies conducted by Dominguez-Garcia et al.19 and Narvaez-Pita et al.68 evaluated the interactions of Cp2WCl2 with human serum albumin (HSA) and Cp2MoCl2 with ubiquitin (Ub), respectively. Their Ksv and kq were found greater than KD, thus showing the same order of magnitude as found for both dichloride metallocenes when studied with apo-hTf. These research groups also have found that Ksv and kq can increase as temperature increases, thus suggesting a dynamic quenching process for these two specific protein-ligand complexes.
Evaluation of the binding constant and the binding site
For a static quenching process, the strength of the ligand-protein interaction is measured in terms of their binding affinity. When a ligand binds reversibly and independently to a set of equivalent sites on a protein with different binding affinities, the quenching association constant (Ka) for the fluorophore,which is analogous to the association binding constant, and the number of binding sites (n) per protein molecule for the ligand-protein system can be obtained using the Modified Stern-Volmer equation:91
where F0 and F are the steady-state fluorescence intensities of apo-hTf in the absence and presence of the quencher, respectively, and [Q] is the concentration of the quencher.
The binding parameters n and Ka were calculated for all Cp2M(IV)Cl2 and for (NH3)2Pt(II)Cl2at a pH=7.4 and at four different temperatures, according to the plot of double logarithm regression curve of log[(F0–F)/F] versus log[Q] as shown in Figure 8 and Figure S8. Moreover, the plots exhibited fairly good linear relationships (R> 0.970), suggesting that a static quenching process has occurred during formation of each apo-hTf:Cp2M(IV)Cl2 complex.92 As shown in Table 3, the number of binding sites (n) obtained from the slope of the plot was found to be close to one, at all temperatures, thus suggesting that a single binding site is available, in agreement with Du et al.63 and Zhang et al.64 for the apo-hTf:Cp2VCl2 complex.
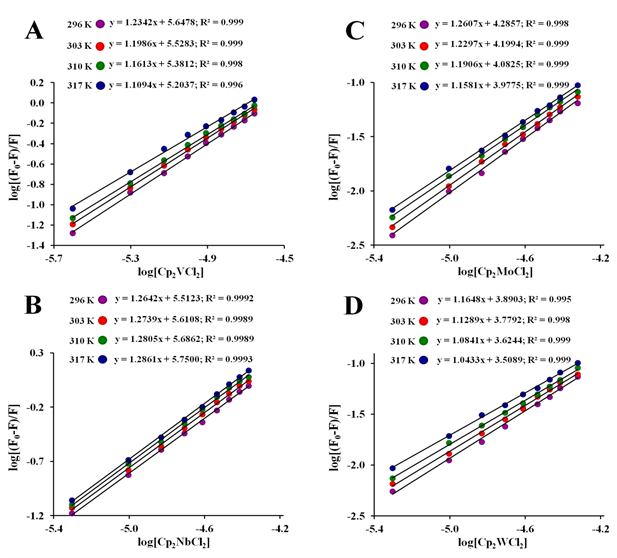
Figure 8 Modified Stern-Volmer plots of log [(F0–F)/F] vs. log [Q]for the apo-hTf:Cp2M(IV)Cl2 complex formation at pH 7.4 and at four different temperatures (296 K, 303 K, 310 K and 317 K). Metallocene dichlorides used herein are Cp2VCl2 (A), Cp2NbCl2 (B), Cp2MoCl2 (C), and Cp2WCl2 (D).

Figure S8 Modified Stern-Volmer plots of log [(F0–F)/F] vs. log [Q]for the formation of four apo-hTf:Cp2M(IV)Cl2 complexes at pH 7.4 and at four different temperatures (296 K, 303 K, 310 K, and 317 K). Metallocene dichlorides used herein are Cp2TiCl2 (A), Cp2ZrCl2 (B), Cp2HfCl2 (C) and (NH3)2Pt(II)Cl2 (D).
Based on each quenching association constant (Ka) obtained from the intercepts of these plots, it was found that for all metallocene dichloridesunder study, Ka is also temperature dependent. For Cp2M(IV)Cl2 (M(IV) = V, Mo, W, Ti, Zr and Hf), Ka decreases as the temperature increases, which suggests a reduction in the stability of the apo-hTf:Cp2M(IV)Cl2 complex when the temperature increases.93 Meanwhile, for Cp2NbCl2 and (NH3)2Pt(II)Cl2, Ka increases as the temperature increases. Additionally, the value of Ka for Cp2VCl2 and Cp2NbCl2is at least one order of magnitude larger (105 M–1) than for Cp2MoCl2 (104 M–1), and two orders of magnitude larger than for other Cp2M(IV)Cl2 (M(IV) =W, Ti, Zr, Hf) and for (NH3)2Pt(II)Cl2 (103 M–1), suggesting that apo-hTf has higher affinity for Cp2VCl2, Cp2NbCl2 and Cp2MoCl2 than for other metallocene dichlorides. As also shown in Table 3, the calculated binding constants for apo-hTf:Cp2M(IV)Cl2 (M(IV) =V, Nb and Mo) complexes suggest a moderated binding affinity with values within the range of 104 M−1 to 105 M−1 compared to other weak protein-ligand complexes (when M(IV) = W, Ti, Zr, Hf) with binding constants £ 103 M−1 or for strong protein-ligand complexes with binding constants ³ 106 M−1.94 Dufour and Dangles100 as well as Suryawanshi et al.,95 among others, considered that most of these compounds (as ligands) can bind reversibly and exhibit moderate affinities to this protein. Thus, any binding between Cp2M(IV)Cl2 and apo-hTf could be considered as moderate, suggesting that a reversible apo-hTf:Cp2M(IV)Cl2 complex formation is possible, and that these metallocene dichlorides could be stored or carried by apo-hTf. Similar results for Ka were found by Du et al.63 (Ka = 1.37x10⁵ M–1) and Zhang et al.64 (Ka = 3.28x10⁴ M–1) when Cp2VCl2 was bound to apo-hTf. However, both authors considered these Ka values much smaller than the binding constants obtained through UV-Vis (and by another methods) when other metals were bound to apo-hTf. However, the binding constants calculated from these fluorescence quenching methods are considered as an apparent association constant, which cannot be directly compared with the data found in the literature.
Thermodynamic parameters and binding forces
The temperature-dependent thermodynamic parameters for those interactions within the apo-hTf:Cp2M(IV)Cl2complex were calculated using the Van’t Hoff equation:90
where K is the binding constant at a corresponding temperature, DH0 is the enthalpy change, DS0 is the entropy change, R is the gas constant, and T is the absolute temperature. Therefore, the Gibbs free energy change (ΔG0) at a corresponding temperature was subsequently derived from the following equation:93
The results obtained for ΔH0, ΔS0 and ΔG0 were then used to determine the intermolecular forces involved between Cp2M(IV)Cl2 and apo-hTf during complex formation. These intermolecular forces could be hydrophobic, hydrogen bonding, van der Waals or electrostatic. In general, Gibbs free energy change reflects the spontaneity of reaction, while ΔH0 and ΔS0 are the main quantities for judging the binding force.95
To pinpoint more the interactions involved during formation of the apo-hTf:Cp2M(IV)Cl2 complex, Ksv constants (at different temperatures) were also used to calculate the corresponding thermodynamic parameters governing these interactions using the Van't Hoff equation, since there is a clear dependence of these constants with the temperature, where it is a function of the intermolecular forces holding the complex together.96 For all Cp2M(IV)Cl2 as well as for (NH3)2Pt(II)Cl2, the three thermodynamic constants ΔH0, ΔS0 and ΔG0 were calculated at pH 7.4, and at four different temperatures, according to the plot of regression curve of ln(Ksv) versus 1/T as shown in Figure 9 and Figure S9. Moreover, these plots exhibited fairly good linear relationships (R >0.970) suggesting a clear dependence of Ksv, temperature and intermolecular forces, governing the formation of each apo-hTf:Cp2M(IV)Cl2 complex. The results shown in Table 4 suggest that these apo-hTf:Cp2M(IV)Cl2 complexes have been formed through a spontaneous ligand-protein interaction processes, because all ΔG0 values were less than zero (negative ΔG0). In addition, it seems that Cp2VCl2 (as well as Cp2NbCl2) can form a more stable complex with apo-hTf compared to other five Cp2M(IV)Cl2 (M(IV) =Mo, W, Ti, Zr and Hf) or even (NH3)2Pt(II)Cl2.
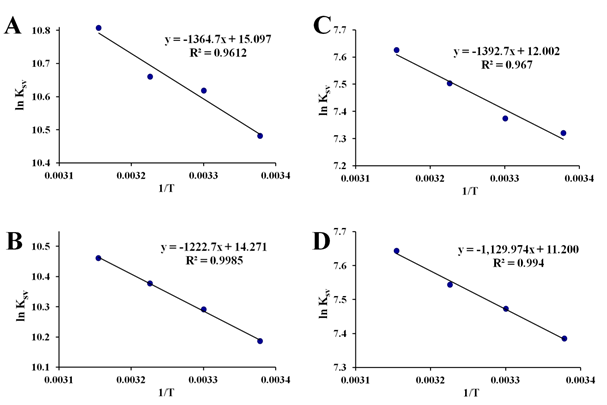
Figure 9 Van’t Hoff plots for the interaction of apo-hTf with Cp2VCl2 (A), Cp2NbCl2 (B), Cp2MoCl2 (C) and Cp2WCl2 (D). All the experiments were performed at pH 7.4.
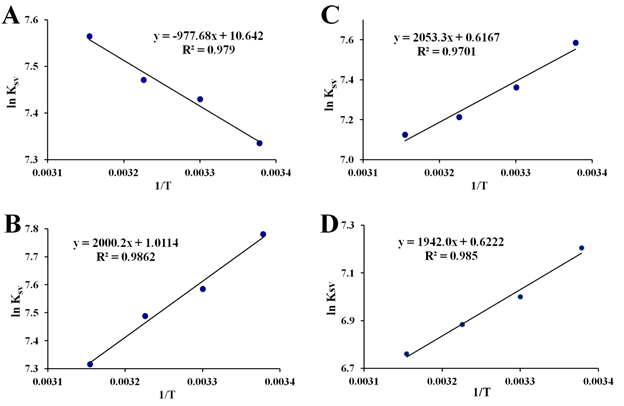
Figure S9 Van’t Hoff plots for the interaction of apo-hTf with Cp2TiCl2 (A), Cp2ZrCl2 (B), Cp2HfCl2 (C) and (NH3)2Pt(II)Cl2 (D) at pH 7.4.
|
Compound |
Temperature (K) |
DH° (kJ/mol) |
DS° (J/mol K) |
DG° (kJ/mol) |
|
Cp2VCl2 |
296 |
11.35 |
125.52 |
–25.81 |
|
303 |
–26.69 |
|||
|
310 |
–27.56 |
|||
|
317 |
–28.44 |
|||
|
Cp2NbCl2 |
296 |
10.17 |
118.65 |
–24.95 |
|
303 |
–25.79 |
|||
|
310 |
–26.62 |
|||
|
317 |
–27.45 |
|||
|
Cp2MoCl2 |
296 |
11.58 |
99.78 |
–17.96 |
|
303 |
–18.66 |
|||
|
310 |
–19.35 |
|||
|
317 |
–20.05 |
|||
|
Cp2WCl2 |
296 |
9.39 |
93.12 |
–18.17 |
|
303 |
–18.82 |
|||
|
310 |
–19.47 |
|||
|
317 |
–20.12 |
|||
|
Cp2TiCl2 |
296 |
8.13 |
88.48 |
–18.06 |
|
303 |
–18.68 |
|||
|
310 |
–19.30 |
|||
|
317 |
–19.92 |
|||
|
Cp2ZrCl2 |
296 |
–16.63 |
8.41 |
–19.12 |
|
303 |
–19.18 |
|||
|
310 |
–19.24 |
|||
|
317 |
–19.30 |
|||
|
Cp2HfCl2 |
296 |
–17.07 |
5.13 |
–18.59 |
|
303 |
–18.62 |
|||
|
310 |
–18.66 |
|||
|
317 |
–18.70 |
|||
|
(NH3)2Pt(II)Cl2 |
296 |
–16.15 |
5.17 |
–17.68 |
|
303 |
–17.71 |
|||
|
310 |
–17.75 |
|||
|
|
317 |
|
|
–17.79 |
Table 4 Thermodynamic parameters ΔH°, ΔS° and ΔG°calculated for each protein-compound complex generated with apo-hTf
Ross and Subramanian have conceptualized a model for ligand binding to proteins based on the signs and magnitudes of the thermodynamic parameters and intermolecular forces contributing to the stability.101 Their model proposes the following three conditions: ΔH0> 0 and ΔS0> 0 for hydrophobic interactions, ΔH0< 0 and ΔS0< 0 for van der Waals forces of attraction or hydrogen bonding, and ΔH0 ~ 0 (slightly positive or negative) and ΔS0> 0 for electrostatic and ionic force interactions. Taking into account all of the above and the results from Table 4, the interactions between Cp2M(IV)Cl2 (M(IV) = V, Nb, Mo, W, Ti) and apo-hTf were mainly hydrophobic (both ΔH0 and ΔS0 were greater than zero) which suggest that formation of their apo-hTf:Cp2M(IV)Cl2 complexes were through an endothermic process, consistent with an increase of Ksv with temperature. Similar results were also reported by Dominguez García et al.,19 and Narváez Pita et al.,68 who found that hydrophobic interactions are mainly the intermolecular forces contributing to the stability between Cp2WCl2 and HSA as well as Cp2MoCl2 with Ub, respectively. On the other hand, Cp2ZrCl2, Cp2HfCl2 and (NH3)2Pt(II)Cl2 show mainly hydrophobic interactions combined, most likely, with van der Waals interactions (dipole–dipole, dispersion), because their ΔH° were less than zero (negative ΔH0) and their ΔS0 were greater than zero (positive ΔS°), suggesting that formation of their complexes were through an exothermic process, consistent with a decrease in Ksv with an increase in temperature. Meanwhile, a positive ΔS° and a negative ΔH° suggests specificity through electrostatic interactions among ionic species in aqueous solution. However, this work should not be mainly attributed to electrostatic interactions since ΔS0 was very small, almost zero for their binding interaction process. For all of these apo-hTf:Cp2M(IV)Cl2 complexes, the binding reaction mechanism were mainly supported by hydrophobic interactions because the principal contribution to ΔG0 arose from ΔH0 rather than from ΔS0, thus making their binding process an enthalpy driven and, as a result, inducing hydrophobic interactions being supported by van der Waals interactions.91 This is consistent with our previous in silico studies where we determined that those complexes formed with Cp2M(IV)Cl2 are engaged in hydrophobic interactions with apo-hTf’s amino acid residues.41
Fluorescence resonance energy transfer (FRET) between apo-hTf and Cp2M(IV)Cl2
The fluorescence resonance energy transfer (FRET) technique was used to determine the energy transfer processes between apo-hTf (donor) and Cp2M(IV)Cl2 (acceptor) without emission of a photon and to measure the molecular distances in biological and macromolecular systems. FRET is a distance-dependent interaction between different electronic excited states of both donor and acceptor molecules. According to Forster’s non-radiative energy transfer (FNRET) theory, the rate of energy transfer depends on three factors: (i) the distance between the donor and the acceptor, which should be < 7 nm, (ii) the relative orientation of the donor and acceptor dipoles, and (iii) the extent of overlap of the emission spectrum of the donor with the absorption spectrum of the acceptor.102 The fluorescence emission spectra of 1.0×10⁻⁵ mol L–1 apo-hTf and the absorption spectra of 1.0×10⁻⁵ mol L–1 Cp2M(IV)Cl2 in 20 mM Tris-HCl buffer at pH 7.4 were obtained at room temperature in the wavelength range of 260 nm to 450 nm. The energy transfer effect is related not only to the distance r between the acceptor and donor, but also to the critical energy transfer distance R0. The efficiency (E) of energy transfer between apo-hTf and Cp2M(IV)Cl2 was calculated, according to the Förster’s equations:103
where F0 and F are the fluorescence intensities of apo-hTf in the absence and presence of Cp2M(IV)Cl2, respectively; r is the binding distance between the amino acid residues of the donor and acceptor in the binding sites; and R0 is the Förster critical energy transfer distance when the efficiency (E) of energy transfer is 50% between the donor and acceptor.The efficiency of the energy transfer E was calculated using the fluorescence intensities of apo-hTf (1.0×10⁻⁵ mol L–1) without and with Cp2M(IV)Cl2 (1.0×10⁻⁵ mol L–1) at room temperature, as shown in Table 5. R0 was calculated from donor emission and acceptor absorption spectra using the following equation according to FNRET theory:75
|
Compound |
J (cm3×L/mol) |
E |
R0 (nm) |
r (nm) |
|
Cp2VCl2 |
1.47×10⁻¹⁵ |
0.281 |
1.78 |
2.08 |
|
Cp2NbCl2 |
1.30×10⁻¹⁴ |
0.26 |
2.56 |
3.04 |
|
Cp2MoCl2 |
6.82×10⁻¹⁴ |
0.162 |
3.38 |
4.44 |
|
Cp2WCl2 |
3.99×10⁻¹³ |
0.15 |
4.53 |
6.05 |
|
Cp2TiCl2 |
7.48×10⁻¹³ |
0.144 |
5.03 |
6.77 |
|
Cp2HfCl2 |
5.03×10⁻¹² |
0.131 |
6.91 |
9.47 |
|
Cp2ZrCl2 |
6.94×10⁻¹² |
0.129 |
7.3 |
10.03 |
|
(NH3)2Pt(II)Cl2 |
7.54×10⁻¹² |
0.118 |
7.4 |
10.35 |
Table 5 Distance parameters calculated for those compounds that can bind apo-hTf
where k2 is the spatial orientation factor related to the geometry of the donor-acceptor dipole, n is the refractive index of medium in the wavelength range where spectral overlap is significant, ØD is the fluorescence quantum yield of the donor in the absence of acceptor, and J is the overlap integral of the emission spectrum of the donor and the absorption spectrum of the acceptor, which was calculated using the following equations:90
whereF(l) is the fluorescence intensity of the fluorescent donor in the wavelength range from l to l+Dl, e(l) is the molar absorption coefficient of the acceptor at wavelength l. J was calculated using a|e-UV-Vis-IR Spectral software 1.4.104J was evaluated by integrating, at a wavelength range from 260 nm to 450 nm, the overlap spectra of Figure10 and Figure S10, as shown in Table 5.
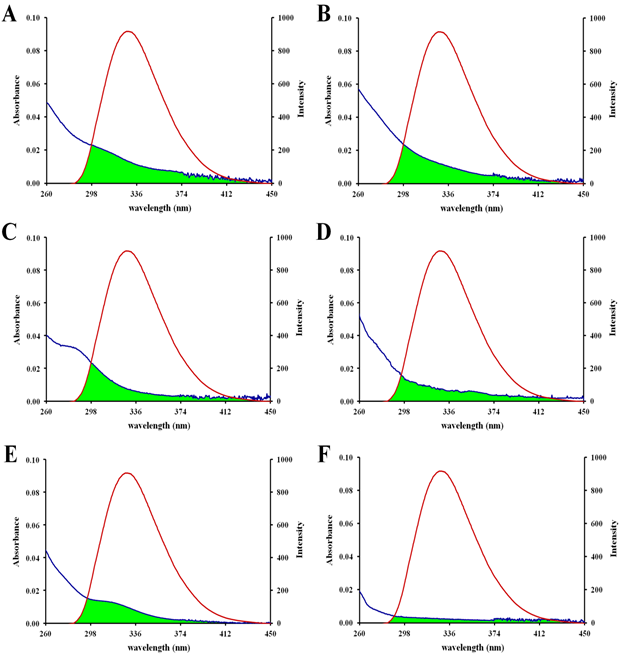
Figure 10 Overlap between fluorescence emission spectra of apo-hTf (1.0×10⁻⁵ mol L–1) and UV-Vis absorption spectra of Cp2VCl2 (A), Cp2NbCl2 (B), Cp2MoCl2 (C), Cp2WCl2 (D), Cp2TiCl2 (E) and Cp2HfCl2 (F). All experiments were set at a final metallocene dichloride concentration of 1.0×10⁻⁵ mol L–1.
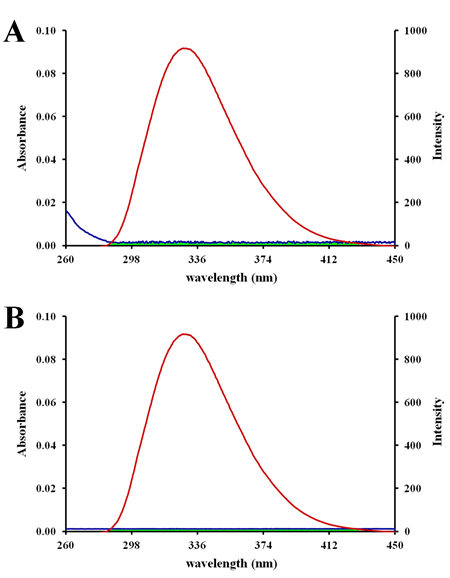
Figure S10 Spectral overlap of fluorescence emission spectra of 1.0×10⁻⁵ mol L–1 apo-hTf and UV-Vis absorption spectra of 1.0×10⁻⁵ mol L–1 Cp2ZrCl2 (A) and (NH3)2Pt(II)Cl2 (B).
The dipole orientation factor (k2) is the least certain parameter that is used in the calculation of the critical transfer distance. Theoretically, k2 can range from 0 to 4, and the extreme values require very rigid orientations. When both the donor and the acceptor tumble rapidly, and are free to assume any orientation, k2 equals 2/3.103 According to previous equations and using n= 1.336 and ØD = 0.118 for apo-hTf,105 the distance parameters R0 and r can be obtained for each metallocene dichloride, as shown in Table 5.
The distance parameters R0 and r were found to be between 1.78-7.40 nm, and between 2.08-10.35 nm, respectively. Average distances r between a donor (fluorophore) and acceptor (quencher) should satisfy the condition 0.5R0 <r< 1.5R0 for a strong energy transfer in agreement to the FNRET theory.102 For example, donor-acceptor distances r between apo-hTf and five of the Cp2M(IV)Cl2 (M(IV) = V, Nb, Mo, W and Ti) were found to be less than 7 nm, suggesting that the energy transfer between apo-hTf and these five metallocene dichlorides should occur with high probability, and by prediction of the FNRET theory, a static quenching interaction should also occur.103,105 Meanwhile, the donor-acceptor distances r between apo-hTf and the last two Cp2M(IV)Cl2 (M(IV) =Hf and Zr) or between apo-hTf and (NH3)2Pt(II)Cl2, were greater than 7 nm, suggesting that the energy transfer between apo-hTf and these two metallocene dichlorides, or between apo-hTf and (NH3)2Pt(II)Cl2, should occur with low probability, and by prediction of the FNRET theory, a dynamic quenching interaction should also occur.75,105 Additionally, the binding distance between the Cp2M(IV)Cl2 (M(IV) =V, Nb, Mo, W, Ti) and apo-hTf was found to be shorter than between Cp2M(IV)Cl2 (M(IV) =Hf, Zr) and apo-hTf, which suggest that the binding affinity between Cp2M(IV)Cl2 (when M(IV) =V, Nb, Mo, W, Ti) and apo-hTf is stronger than between Cp2M(IV)Cl2 (when M(IV) =Hf, Zr) and apo-hTf.90 These findings are consistent with the results obtained from the UV-Vis and fluorescence spectra reported herein.
CD spectroscopy
Circular dichroism (CD) is an excellent, non-destructive and powerful technique for providing information about the secondary structure of a protein and its structural conformational changes when interacts with small molecules in solution. Far- and near-UV CD spectra can be used to characterize the secondary structure and side-chain environments of proteins, respectively.68 The observed ellipticity in millidegrees, θ, were expressed in terms of the mean residue ellipticity (MRE), also called molar ellipticity [θ] in deg cm2 dmol–1, according to the following equation:64
where Cp is the molar concentration of the protein, n is the number of amino acid residues in the protein and l is the path length (1.0 cm). The α-helical content of apo-hTf was calculated from the [θ] value at 208 nm using the following equation:64
where are the experimental MRE values at 208 nm; 33,000 and 4,000 are the MRE values for a pure α-helix and pure β-sheet, and for a random coil conformation, respectively, at 208 nm. The β-sheet and random coil content of apo-hTf were calculated using the Raussens et al. method (CD-RRG).106
Figure 11 and Figure S11 show the far-UV CD spectra of apo-hTf in the absence and presence of different concentrations of Cp2M(IV)Cl2 in 2.0 mM Tris-HCl buffer at pH 7.4. The obtained far-UV CD spectra of native apo-hTf were consistent with those previously reported by Tomimatsu et al.,107 Ali et al.,108 and Amroabadi et al.,96 The far-UV CD spectrum of apo-hTf (between 190 nm and 250 nm) shows the prevalence curve for a typical α-helix structure with a broad positive maximum around 193 nm and a negative minimum around 209 nm. The absorption within this region is mainly due to the peptide bond (amide groups) and are influenced by the geometries of the polypeptide backbone. There is a weak, but broad, n®π* transition centered around 209 nm and a more intense π®π* transition around 193 nm.105
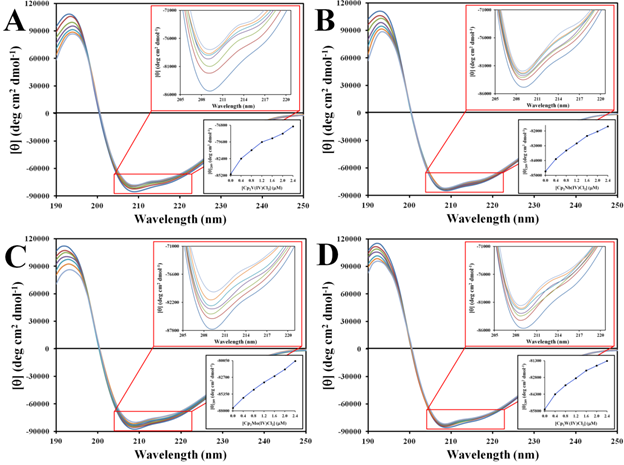
Figure 11 Far-UV CD spectra at 298 K of apo-hTf in 2.0 mM Tris-HCl, pH 7.4, in the presence and absence of Cp2VCl2 (A), Cp2NbCl2 (B), Cp2MoCl2 (C) and Cp2WCl2 (D). The red inset shows enlarged the region at 209 nm. The black inset shows a graph of the mean residue molar ellipticity [q] at 209 nm vs [Cp2M(IV)Cl2].

Figure S11 Far-UV CD spectra at 298 K of apo-hTf in 2.0 mM Tris-HCl, pH 7.4, in the absence and presenceof Cp2TiCl2 (A), Cp2HfCl2 (B), Cp2ZrCl2 (C) and (NH3)2Pt(II)Cl2 (D). The red inset shows enlarged the region at 209 nm. The black inset shows a graph of the mean residue molar ellipticity [q] at 209 nm vs [Cp2M(IV)Cl2] or [(NH3)2Pt(II)Cl2].
After titration of Cp2M(IV)Cl2 (M(IV) =V, Nb, Mo and W), the far-UV CD spectra of apo-hTf showed significant changes in its absorption curve at both wavelengths 193 nm and 209 nm (Figure 11), when compared to the far-UV CD spectra of native apo-hTf. However, when apo-hTf was titrated with Cp2M(IV)Cl2 (M(IV) =Ti, Hf, Zr) and with (NH3)2Pt(II)Cl2, the far-UV CD spectra were not disturbed (Figure S11A). As shown in Figure 11, a decrease in peak intensity (red insets) was observed at 193 nm and 209 nm, suggesting a strong conformational change of apo-hTf when titrated with Cp2M(IV)Cl2 (M(IV) =V, Nb, Mo and W). The results suggest that these metallocene dichlorides can induce changes on the protein secondary structure of apo-hTf, and even at very low concentration. Table 6 shows the percentages calculated from the obtained CD spectral data of the secondary structure elements in apo-hTf, in the presence and absence of Cp2M(IV)Cl2. In general, the percentage of α-helix decreases as the concentration of the metallocene dichloride increases, whereas the percentages of β-sheet and random coil increased. These changes were more notable when apo-hTf was titrated with Cp2M(IV)Cl2 (M(IV) =V, Nb, Mo and W) than with Cp2M(IV)Cl2(M(IV) =Ti, Hf, Zr) and (NH3)2Pt(II)Cl2. The CD data suggest, in agreement with fluorescence studies, that somewhat changes in its secondary structure occur when apo-hTf is involved in interactions with these metallocene dichlorides. The black insets located in Figure 11 and Figure S11A show the relationship between the changes in mean residue molar ellipticity at 209 nm with respect to metallocene dichloride concentration. The results suggest that these metallocene dichlorides can induce a loss of the apo-hTf secondary structure upon binding, as a signal of complex formation.
Compound |
Secondary structure elements |
Contents secondary structure of apo-hTf (%) |
||||||
Compound concentration (M) |
||||||||
|
|
0 |
0.4 |
0.8 |
1.2 |
1.6 |
2 |
2.4 |
Cp2VCl2 |
a-helix |
29 |
28.4 |
27.9 |
27.2 |
26.5 |
25.8 |
25.1 |
b-sheet |
17.7 |
17.9 |
18.1 |
18.3 |
18.5 |
18.9 |
19.2 |
|
random coil |
33.5 |
33.7 |
33.9 |
34.1 |
34.3 |
34.5 |
34.6 |
|
other |
19.8 |
20 |
20.1 |
20.4 |
20.7 |
20.8 |
21.1 |
|
Cp2NbCl2 |
a-helix |
29.8 |
29 |
28.7 |
27.6 |
26.9 |
26.2 |
25.4 |
b-sheet |
17.3 |
17.7 |
17.9 |
18.5 |
18.9 |
19 |
19.4 |
|
random coil |
33.6 |
33.8 |
34 |
34.2 |
34.4 |
34.6 |
34.8 |
|
other |
19.3 |
19.5 |
19.4 |
19.7 |
19.8 |
20.2 |
20.4 |
|
Cp2MoCl2 |
a-helix |
29.3 |
28.7 |
28.3 |
27.6 |
27.1 |
26.5 |
25.8 |
b-sheet |
17.9 |
18.1 |
18.3 |
18.4 |
18.6 |
18.9 |
19.3 |
|
random coil |
33.8 |
33.9 |
34 |
34.1 |
34.3 |
34.5 |
34.7 |
|
other |
19 |
19.3 |
19.4 |
19.9 |
20 |
20.1 |
20.2 |
|
Cp2WCl2 |
a-helix |
30.2 |
29.8 |
29.5 |
29.1 |
28.3 |
27.9 |
27.5 |
b-sheet |
18.1 |
18.2 |
18.3 |
18.4 |
18.5 |
18.6 |
18.7 |
|
random coil |
33.5 |
33.7 |
33.8 |
33.9 |
34.1 |
34.3 |
34.4 |
|
other |
18.2 |
18.3 |
18.4 |
18.6 |
19.1 |
19.2 |
19.4 |
|
Cp2TiCl2 |
a-helix |
29.5 |
29.3 |
29.1 |
29 |
28.8 |
28.6 |
28.4 |
b-sheet |
17.8 |
18 |
18.2 |
18.3 |
18.4 |
18.5 |
18.6 |
|
random coil |
33.8 |
33.8 |
33.8 |
33.9 |
33.9 |
34 |
34 |
|
other |
18.9 |
18.9 |
18.9 |
18.8 |
18.9 |
18.9 |
19 |
|
Cp2HfCl2 |
a-helix |
29.8 |
29.7 |
29.5 |
29.3 |
29.1 |
29 |
28.7 |
b-sheet |
17.4 |
17.5 |
17.6 |
17.7 |
17.8 |
17.9 |
18 |
|
random coil |
33.6 |
33.7 |
33.8 |
33.8 |
34 |
34 |
34.1 |
|
other |
19.2 |
19.1 |
19.1 |
19.2 |
19.1 |
19.1 |
19.2 |
|
Cp2ZrCl2 |
a-helix |
29.4 |
29.2 |
29.1 |
29 |
28.8 |
28.6 |
28.4 |
b-sheet |
18 |
18.1 |
18.2 |
18.3 |
18.4 |
18.5 |
18.6 |
|
random coil |
33.8 |
33.8 |
33.9 |
33.9 |
33.9 |
34 |
34.1 |
|
other |
18.8 |
18.9 |
18.8 |
18.8 |
18.9 |
18.9 |
18.9 |
|
(NH3)2Pt(II)Cl2 |
a-helix |
29.2 |
28.9 |
28.7 |
28.5 |
28.3 |
28.1 |
28 |
b-sheet |
18 |
18.1 |
18.2 |
18.3 |
18.4 |
18.5 |
18.6 |
|
random coil |
33.9 |
33.9 |
33.9 |
34 |
34 |
34.1 |
34.1 |
|
other |
18.9 |
19.1 |
19.2 |
19.2 |
19.3 |
19.3 |
19.3 |
|
Crystallographic or far-UV CD data reported by: |
96 |
109 |
108 |
|||||
apo-hTf |
a-helix |
31 |
32 |
41.5 |
||||
b-sheet |
18 |
22 |
28.4 |
|||||
random coil |
51 |
46 |
30.1 |
|||||
|
other |
|
|
|
|
|
|
|
Table 6 Contents secondary structure elements (α-helix, β-sheet, and random coil) of apo-hTf in the presence and absence of seven Cp2M(IV)Cl2 and DCCP based on the Raussens et al.’s method (CD-RRG)
The far-UV CD spectra of apo-hTf (in the absence of a metallocene dichloride) show a percentage of α-helix stretching from 29.0% to 30.2% and of β-sheet stretching from 17.3% to 18.1%. The results were similar to those reported by Amroabadi et al., where the CD spectral data of native apo-hTf was determined to be 30.2% for α-helix and 16.9% for β-sheet using the Chou and Fasman method.96 On the other hand, Nishikawaalso obtained similar results (31% of α-helix and 18% of β-sheet) from the 3D structure of apo-hTf defined by crystallographic measurements.109 However, Ali et al. reported an analysis of the far-UV CD spectrum of recombinant apo-hTf with the SELCON program, showing a well-defined secondary structure with an α-helix and β-sheet content of 41.5% and 28.4%, respectively.108
Near-UV CD spectrum of native apo-hTf (from 250 nm to 300 nm) shows different bands due to the aromatic amino acid residues within the protein. This spectral range also gives information on short-range interactions of the aromatic side chains of apo-hTf with other optically active groups of the protein, including other aromatic side chains.96 Changes in position or interactions among the aromatic groups may imply changes in CD spectra recorded in the range of 250 nm to 300 nm. Signals at a wavelength range from 250 nm to 270 nm are attributed to phenylalanine, from 270 nm to 290 nm are attributed to tyrosine, and those from 290 nm to 300 nm are attributed to tryptophan.105 These bands regularly decrease or increase with increasing concentration of metallocene dichloride, suggesting that the interaction apo-hTf with these compounds partially disrupts the anisotropic environment of the aromatic residues (Figure 12 & Figure S12).
This work put under perspective consistencies and discrepancies found in our preliminary in silico studies. The in silico studies helped us to explain how seven metallocene dichlorides [Cp2M(IV)Cl2 (M(IV) = Ti, Zr, Hf, V, Nb, Mo, W)] might be engaged in hydrophobic interactions with those amino acid residues located in the C-lobe or N-lobe of apo-hTf, outside of the iron binding site.41 It is also shown that the stability of apo-hTf:Cp2M(IV)Cl2 complexes is in the order of V > Nb > Mo ~ W > Zr ~ Hf > Ti.44 These results were consistent with experimental Ka and ΔGo values, as shown in Tables 3&4, respectively. Furthermore, it seems that metallocene dichlorides are mainly engaged in hydrophobic and van der Waals interactions with apo-hTf, in correlation with the thermodynamic parameters ΔHo and ΔSo (Table 4). The van der Waals interaction became truly important for Ti, Zr and Hf, which mostly reveal their very low stability. The level of stability and binding affinity of Cp2M(IV)Cl2(M(IV) = Ti, Zr, Hf, V, Nb, Mo, W) also correlate to the type of quenching. Those metallocene dichlorides with very high binding affinity (M(IV) = V, Nb, Mo, W) can undergo static quenching, whereas those with low binding affinity (M(IV) = Ti, Zr, Hf) can undergo dynamic quenching. It is important to notice that their binding affinity also correlates to their CD titration spectra. Perturbations on secondary structures (α-helix, β-sheet and random coil) were more pronounced when of apo-hTf was titrated with Cp2M(IV)Cl2 (M(IV) = V, Nb, Mo, W). These four organometallic compounds have high binding affinity and are engaged in shorter distances with apo-hTf based on FNRET theory (Table 5). According to UV-Vis absorption analysis, titration of apo-hTf with Cp2M(IV)Cl2 (M(IV) = V, Mo, W) caused an immediate band formation at 361 nm attributed to MLCT, but this result was difficult to predict in our in silico studies because of the absence of water molecules. It is remarkable to notice this MLCT effect because the buffer under use does not have any synergistic anion to form a complex in the iron binding sites. Nevertheless, titration of Cp2M(IV)Cl2 (M(IV) = Mo and W) show that the band at 361 nm can appear after the fourth aliquot, suggesting that the first interaction of these two metallocene dichlorides are mainly hydrophobic (in agreement with the in silico docking studies) and eventually they occupy a second binding site, most likely the iron binding site. Thus, the molecular mechanism of action forthe metallocene di chlorides (Figure 13) might involve accumulation in the nucleifollowed by alate step where coordination to DNA phosphates might occur for suppressing DNA synthesis and/or inhibition of nuclear enzymes,44,46,49,53–55 while for cisplatin it is through an inter-strand crosslinked coordination of platinum to N7 of the guanine residue.42,43,84 Based on our results, another possible mechanism mediated by apo-hTf might occur where Cp2M(IV)Cl2 (M(IV) = Ti, Zr, Hf, V, Nb, Mo, W) bind to different hydrophobic sites outside the iron binding sites. This new mode of interaction might abrogate the typical formation of the hTf:Tf-R (receptor) complex, thus suppressing the iron metabolism and transporting metallocene dichlorides inside the cell and, as a consequence, inducing cell death.
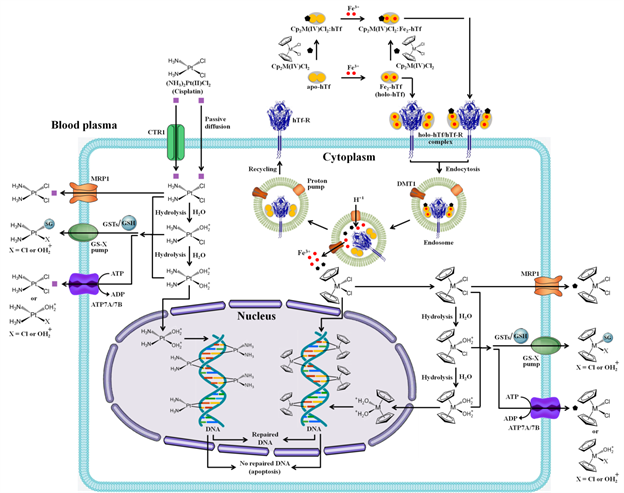
Figure 13 Proposed molecular mechanismof action for metallocene dichlorides (Cp2M(IV)Cl2) associated to the hTf:hTf-Rcomplex and for cisplatin ((NH3)2Pt(II)Cl2).Abbreviations: CTR1 (chloride transport receptor 1); GSH (glutathione); GSTs (glutathione S-transferase); MRP1 (multidrug resistance-associated protein 1); GS-X pump (ATP-dependent glutathione S-conjugate export pump); ATP7A/7B (copper transporters ATPase copper-transporting alpha (ATP7A) and ATPase copper-transporting beta (ATP7B)).
The cytotoxicity of several metallocene dichlorides against MCF-7 cells and HT-29 cells was determined using MTT assay, and their interaction with apo-hTf was investigated in vitro using different spectroscopic techniquesunder physiological conditions. All metallocene dichlorides exhibited an antiproliferative effect on HT-29 cells, whereas Cp2M(IV)Cl2 (M(IV) =V, Nb, Ti, W) and Cp2M(IV)Cl2 (M(IV) = Mo, Hf, Zr) exhibited an antiproliferative effect and proliferative activity on MCF-7 cells, respectively. Only Cp2VCl2 exhibited cytotoxicity similar to that of (NH3)2Pt(II)Cl2 against both human cancer cell lines. Furthermore, apo-hTf has shown that can enhance the antiproliferative activity of Cp2M(IV)Cl2 (M(IV) = V, Nb and Mo), suggesting its vital role as a protein carrier of these three metallocene di chlorides. Changes in the UV-Vis absorption spectra also suggested formation of a ground state complex, and the CD data suggested that any interaction between a metallocene dichloride and apo-hTf could significantly affect the protein’s conformation. Changes in secondary and tertiary structures became visible even at low concentration of these compounds. FRET results suggest that only three Cp2M(IV)Cl2 (M(IV) = V, Nb and Mo) has a strong binding affinity for apo-hTf by inducing a strong quenching effect on its fluorescence spectrum. Other metallocene dichlorides could bind this protein, but more weakly, maybe due to differences in their binding modes. Our study also showed that metallocene dichlorides quenched the apo-hTf intrinsic fluorescence mainly through a static quenching mechanism. Site binding constants and the number of binding sites for each protein-ligand complex formed were determined at four different temperatures. The calculated thermodynamic parameters suggest that hydrophobic forces are playing vital roles in their binding interaction, mainly through an endothermic and spontaneous process. Binding distances of these apo-hTf:Cp2M(IV)Cl2 complexes were calculated on the basis of the Forster's theory, which results suggest that the energy transfer could occur. Thus, all the experimental data have provided a valuable insight of the binding mechanism of Cp2M(IV)Cl2 for apo-hTf, in agreement with our previous in silico studies.
Dr. Enrique Meléndez is grateful for the financial support of NIH–COBRE II and NIHSCORE S06 GM008103–37 at UPR–Mayagüez. This publication was supported by an Institutional Development Award (IDeA) from the National Institute of General Medical Sciences of the National Institutes of Health under grant number P20 GM103475-14 and the RCMI grant U54 MD007600 (National Institute on Minority Health and Health Disparities) from the National Institutes of Health. The content is solely the responsibility of the authors and does not necessarily represent the official views of the National Institutes of Health.
The authors declare that they have no conflicts of interest.

©2020 Fernández, et al. This is an open access article distributed under the terms of the, which permits unrestricted use, distribution, and build upon your work non-commercially.