International Journal of
eISSN: 2573-2838


Research Article Volume 4 Issue 4
St Petersburg State University, Russia
Correspondence: Konstantin N Mikhelson, Chemistry Institute, St Petersburg State University, 26 Universiteskij Pr., Stary Peterhof, 198504, St Petersburg, Russia, Tel +7 812-4284062
Received: June 12, 2018 | Published: July 10, 2018
Citation: Muratova IS, Mikhelson KN. Voltammetric sensing of dopamine in urine samples with electrochemically activated commercially available screenprinted carbon electrodes. Int J Biosen Bioelectron. 2018;4(4):17910.15406/ijbsbe.2018.04.00120
Simple electrochemical pretreatment by cycling is used for the activation of commercially available screen-printed carbon electrode (Gwent Group). After the pretreatment the electrode allows for measurements of dopamine by differential pulse voltammetry in the presence of ascorbic and uric acids, and in human urine samples.
Keywords: dopamine, urine, voltammetry, screen-printed electrode, electrochemical activation
Dopamine (DA) is a representative of neurotransmitters (neuromediators) responsible for the transfer of neural signals in human and animal bodies.1–5 The level of dopamine in the human body is crucial for learning and memory, for cardiovascular and renal systems, and for human behavior.1–3,6–8 Deviations from normal levels of dopamine cause schizophrenia, Parkinson’s disease, and a number of other health problems, including drug addiction.9–12 Normal levels of dopamine concentration, dependent on the age, are from 0.1 to 0.4 nM in the blood, variation in urine is wider: from 0.1 to 2 μM.13,14 Thus, in real samples, dopamine must be measured at rather low concentrations and in the presence of various interferences, in particular ascorbic acid (AA) and uric acid (UA). Liquid chromatography is the method of choice for measurements of dopamine and other catecholamine’s in clinics.15 However, electrochemical methods of the dopamine control attract increasing attention because electrochemical sensing is promising in view of a rapid, sensitive, selective, and low-cost detection of various biomolecular analytes. Among electrochemical methods of dopamine sensing, it was reported on potentiometry with electrodes selective either to dopamine,16,17 or to ions involved in the dopamine oxidation process, e.g IO4−.18 Due to insufficient selectivity and sensitivity, these measurements are only suitable to control pharmaceutical formulations, but not for body fluids. A possibility was demonstrated of sensing dopamine resist metrically, with arrays of gold nanowires.19 The data presented in reviews on various techniques of measurements of dopamine20–23 indicate voltammetry as the predominating approach to measure this analyte electrochemically.
Voltammetric sensing of dopamine in real samples (blood serum, urine) is, normally, achieved by modification of the electrode (typically, glassy carbon) surface.23–38 Glassy carbon electrodes (GCEs) were modified with sulfonated graphene23 or with reduced graphene oxide.24,25 There are reports on the use of GCE modified with various composite materials: a SiO2-coated graphene oxide and molecularly imprinted polymers,26 nanocomposite with carbon nanotubes,27–29 NiFe2O4 magnetic nanoparticles decorated with multiwall carbon nanotubes,30 with a carbon nanohorns/poly(glycine) composite,31 with poly(o-methoxyaniline)-gold (POMA-Au) nanocomposite,32 with a complex of gold nanoparticles and multiwall carbon nanotubes.33 GCE modified with a combination of fullerene (C60)-functionalized carbon nanotubes and ionic liquid 1-butyl-3-methylimidazolium tetrafluoroborate was used to determine several catecholamine’s: nor epinephrine, isoprenaline and dopamine.34 Promising results were obtained using GCE dip-coated with AuNPs@SiO2 core-shell molecularly imprinted composite.35 GCE modified with carbon nanotubes incorporated with sol–gel derived La(OH)3 nanorods allowed for the measurements of DA, AA, UA and NO2− in DA injection solution and in urine diluted 100-fold with 0.1 M PBS pH 6.36 Modified GCEs allowed measurements of dopamine in urine at the levels of 5–30μM.23–28,30–32,34–37 Polyvinylpyrrolidone/graphene modified GCE showed the detection limit of 0.5 nM dopamine. However, the recovery tests with these sensors in real samples were done at rather high concentrations, e.g. 200μM dopamine in urine and 100μM in serum.37 Simultaneous determination of dopamine, uric acid, and ascorbic acid with GCE modified with stacked graphene platelet nanofibers/ionic liquid ([BMIM][BF4])/chitosan has been reported. DA was detected in human urine samples 10-fold diluted with 0.1 M PBS pH 6 at the level of 14-30μM,38, and down to 1μM33 and even to 0.1μM.29 In view of cost and labor reduction it is very tempting to use disposable screen-printed electrodes as dopamine sensors. It was reported on screen-printed electrodes made with a graphene- containing ink.39 Screen-printed electrodes were modified with palladium nanoparticles decorated with fullerene,40 with nanogold,41 with single walled carbon nanotubes and ionic liquids.42 The reported detection limits for DA were 0.16,42 0.05640 and 0.008 μM41 in artificial samples. In urine DA was successfully recovered at the levels of 0.02 – 0.05μM.41 Good results have been achieved when screen-printed electrodes modified with graphite/nafion composite are electrochemically activated by applying constant potential of 2.0V for 300s.43 It is known that electrochemical activation e.g. by pre-anodization at highly positive polarization potentials significantly improves the sensitivity of screen-printed electrodes.44,45 It is therefore very tempting to try sensing with commercially available screen-printed electrodes, activated electrochemically instead of a chemical modification. This approach has been successfully used for a significant improvement of the detection limit of commercially available screen-printed electrodes: using a pretreated Dropsens electrode L-dopa was successfully measured in pharmaceutical formulations.46,47 In this paper we use the same approach and show for the first time that commercially available, non-modified screen-printed carbon electrodes after activation by sequential cycling can be used for successful dopamine sensing in the presence of ascorbic and uric acids, and in real urine samples.
Dopamine hydrochloride (DA) (99%) was from Alfa Aesar, Germany, uric acid (UA) (99%) and ascorbic acid (AA) (reagent grade) were from Sigma-Aldrich. All other chemicals, as well as pH standard solutions, were of analytical grade and obtained from Reactive, Russia. Aqueous solutions of DA, AA, UA and their mixtures contained phosphate buffer pH 6.86 with 0.01 M KCl background (PBS). All aqueous solutions were prepared with deionized water with resistivity of 18.2 MΩ, Milli-Q-Reference Water Purification System, France. All electrochemical measurements were made with potentiostat–galvanostat Autolab 302N, Metrohm, Switzerland. Disposable screen-printed three electrode systems BE2150327D2/001 with carbon working electrode, 60/40 ratio Ag/AgCl reference electrode and carbon counter electrode were from Gwent Group Advanced Material Systems, UK. The presence of chloride background in solutions ensured reliable work of the Ag/AgCl reference electrode in the screen-printed electrode system. Below, all potential values are given vs. Ag/AgCl, 0.01 Cl─. For ease of the electrode connection to Autolab, wires were glued to the contact pads of screen-printed electrode with custom-made conducting glue, and sealed with silicone seal Tytan from Carina Sealants Sp. z.o.o. S.K.A., Poland, Figure 1. CVs were recorded from -0.4 V to 0.6 V at scan rate 20 mV s─1. DPVs were recorded within the same potential range, step was 0.005 V, step amplitude was 0.050 V, pulse duration was 200 ms, and interval between pulses was 1s. Scanning electron microscopic images were taken with HITACHI S-3400N device, mode: SE, high vacuum, 20 kV, 10 mm. All measurements were performed at room temperature: 18–22 oC. Safety considerations: handling DA and other chemicals requires standard chemical laboratory safety measures, and handling urine samples requires use of a hygienic mask.
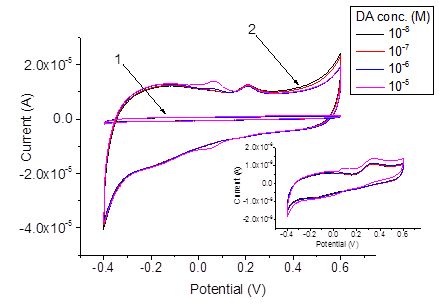
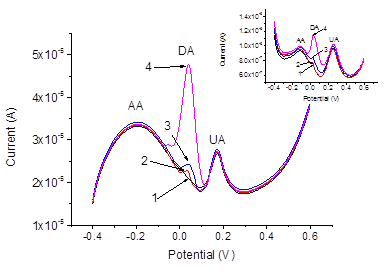
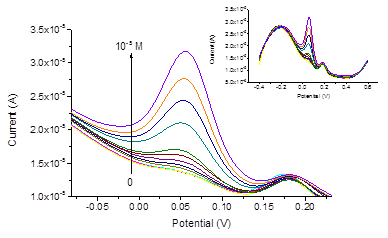
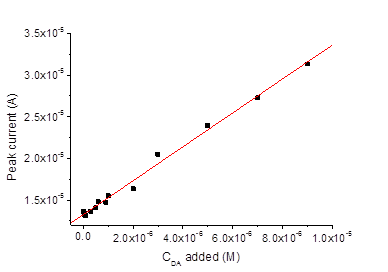
For the electrochemical pretreatment and also for the subsequent measurements, a drop of the respective aqueous solution or a urine sample was placed on the surface of the screen-printed electrode system. The volume of the drop was always 200μl. The electrodes were pretreated by performing 10 sequential cyclic voltammetric scans within the potential range from -0.2 V to 3.0 V (-0.06 – 3.14 V vs. sat. Ag/AgCl), in PBS, the scan rate was 500 mVs-1. Thus, the pretreatment procedure was the same as described elsewhere47 except using PBS (pH 6.86) instead of Britton-Robinson buffer with pH 2.21. The activation of the electrodes due to the electrochemical pretreatment is often ascribed to the increase of the porosity and roughness of the electrode surface, and to the removal of possible contaminations from the electrode.44 In addition, the increase of the effective electrode surface may be due to a partial removal of the binder.47 Our results obtained by SEM imaging of the electrodes before and after the pretreatment also reveal increased roughness of the electrode surface after the pretreatment, see Figure 2. The sizes of the pimples on the surface were about 2μm before the pretreatment and become smaller: about 0.5–1μm after the pretreatment. Before and after the pretreatment, CVs were recorded in mixed solutions of DA, AA, and UA with PBS background, see Figure 2. It is well known that for AA, DA and UA the series of the oxidation peak potentials looks as follows: AA< DA< UA. For sure attribution of the peaks, CVs and DPVs were recorded in mixed solutions containing DA, AA and UA with different concentrations of DA. The results are presented in Figure 3. Before the pretreatment, the oxidation peaks can be seen at -0.117 V for AA, at 0.035 V for DA and at 0.260 V for UA. The peaks are very much better resolved in the DPV mode, compare (Figure 3) (Figure 4). After the pretreatment, the oxidation peaks shifted to -0.190, 0.051, and 0.175 V respectively. Furthermore, the currents in both CV and DPV modes increased after pretreatment in about 20–40 times, which allows for the detection limit of DA at 10 nM. This drastic improvement appear somewhat surprising because SEM images (Figure 2) suggest only moderate change of the surface morphology after the pretreatment procedure. Tentatively, we would ascribe this large increase of the current densities, as well as shifts of the peak potentials, to partial oxidation of carbon electrode surface during fast scans to the potentials up to 3.14 V. Formation of various oxides on the electrode surface may have bigger impact to the growth of the current density than relatively small increase of the surface area seen in Figure 2. Promising results obtained for mixed solutions containing DA, AA, and UA encouraged us to explore the use of the pretreated screen-printed carbon electrodes in real urine samples. The samples were taken from four volunteers, and 60-fold diluted with PBS. The results of the DPV measurements in the PBS and in urine sample 1 60-fold diluted with PBS, with DA additions are presented in Figure 5. The dependence of the peak current on the DA concentration was linear: (A), , see Figure 6. Analogous results were obtained with urine samples 2-4. The AA and DA oxidation peaks in urine samples were slightly shifted as compared with artificial mixed solutions: from -0.190 to -0.206 V for AA, and from 0.051 to 0.054 V for DA. The UA oxidation peak remained at 0.175 V. The results obtained by standard additions to 60-fold diluted samples, the same re-calculated for the non-diluted samples, and the values independently measured in the same samples by HPLC (In vitro, SPB) are shown in Table 1.

Figure 3 CVs recorded with screen-printed electrodes in mixed samples containing 10-5 M AA, 10-5 M UA and various concentrations of DA. 1 and inset – before pretreatment, 2 - after pretreatment.

Figure 4 DPVs recorded with screen-printed electrode after pretreatment in mixed samples containing AA (10-5 M), UA (10-5 M) and DA: 10-8 M – 1, 10-7 M – 2, 10-6 M – 3, 10-5 M – 4. Inset shows the same before pretreatment.

Figure 5 DPV-mode dopamine measurements in urine sample 1 60-fold diluted with PBS, by standard additions of DA from 10−8 to 10−5 M DA. Inset: whole DPV curves registered in the measurements.

Figure 6 DPV peak currents (at 0.054 V) measured in urine sample 1 60-fold diluted with PBS, with DA additions.
Sample |
DA by standard additions to diluted sample (μM) |
DA re-calculated for non-diluted samples (μM) |
DA by HPLC (μM) |
Electrode/HPLC (%) |
1 |
0.11 |
6.6 |
6.5 |
102 |
2 |
0.027 |
1.6 |
1.7 |
94 |
3 |
0.018 |
1.1 |
1 |
110 |
4 |
0.023 |
1.4 |
1.3 |
108 |
Table 1 Results of the DA measurements in human urine samples
The results obtained here with DA measurements in urine are consistent with findings, which refer to successful measurements of L-dopa in pharmaceutical formulations with electrochemically pretreated screen-printed carbon electrodes.47 Without a doubt, modification of the electrode surface may allow for better results, especially in terms of the detection limit. However, the simplicity of the pretreatment procedure makes this approach practical, particularly for disposable sensors. On the other hand, further studies are needed to understand why this simple procedure allows for increased sensitivity to DA which, in turn, allows measurements in real urine samples.
St. Petersburg State University is greatly acknowledged for financial support, grant 12.38.235.2014.
Ms. Lisa Miller is kindly acknowledged for improving the English of the paper. The Geomodel resource center of the Scientific Park of St. Petersburg State University, and personally Mr. Vladimir Shilovskikh are acknowledged for taking SEM images. In vitro SPB is acknowledged for independent measurements by HPLC method.
Author declares that there is no conflict of interest.

©2018 Muratova, et al. This is an open access article distributed under the terms of the, which permits unrestricted use, distribution, and build upon your work non-commercially.