International Journal of
eISSN: 2573-2838


Research Article Volume 4 Issue 3
1Applied Research & Photonics Inc, USA
2Department of Natural Sciences, Coppin State University, USA
Correspondence: Jamal Uddin, Center for Nanotechnology, Coppin State University, 2500 W. N. Ave, Baltimore, MD 21216, USA, Tel 1-410-951-4118
Received: June 12, 2018 | Published: June 25, 2018
Citation: Rahman A, Rahman AK, Ghann W, et al. Terahertz multispectral imaging for the analysis of gold nanoparticles’ size and the number of unit cells in comparison with other techniques. Int J Biosen Bioelectron. 2018;4(3):16910.15406/ijbsbe.2018.04.00118
In this work, we investigate the use of a Terahertz multispectral reconstructive imaging technique to measure the size of individual gold nanoparticles and accordingly the number of unit cells in a given gold nanoparticle. The gold nanoparticles were synthesized by the Frens-Turkevich citrate method and characterized by UV-Vis absorption spectroscopy, Dynamic light Scattering, and Transmission Electron Microscopy as well as by terahertz 3D image analysis. The size of the gold nanoparticles as determined by the Terahertz reconstructive imaging was 18.5 nm which was comparable to the size obtained by the other aforementioned measurement techniques with the exception of Dynamic light scattering which actually measures the hydrodynamic diameter. Using the size of the gold nanoparticles determined by terahertz reconstructive imaging, the number of unit cells in the gold nanoparticle was computed to be 48,825. The results demonstrate that Terahertz multispectral reconstructive imaging is a powerful nondestructive, non-contact technique for the size analysis of gold nanoparticles.
Keywords: nanoparticles, cells, nano-optoelectronic components, bio-photonics, nanosensors, 3D image analysis, nanomaterials
Advances in the controlled assembly of nanoscale building blocks, such as gold and silver nanoscale spheres, and quantum dots (QDs) have resulted in functional devices, such as nano-optoelectronic components, bio-photonics, nanosensors, and novel contrast probes for molecular imaging.1,2 In the assembled structures, the photophysical properties of nanomaterials are a function of the number and the size of the nanomaterials and the distances among them. For instance, the fluorescence lifetime of a quantum dot cluster depends on the number of the QDs, due to the energy transfer between them.3 The surface enhanced Raman spectroscopy (SERS) signal in noble metal nanoparticle arrays depends not only on the properties of the building blocks, but also on the geometric characteristics of the whole array, such as array size. The absorption band of gold nanoparticles is a function of the size and the different fractal structures of the gold nanoparticles and depends on electron-photon relaxation rate.4 Therefore, accurate determination of the size parameter of the nanomaterials is important in order to control the photophysical properties of these nanomaterials. Techniques currently deployed in the determination of particle size include Dynamic Light Scattering,5 Transmission Electron microscope,3 Scanning Electron Microscope7 and Atomic Force Microscope.8 The measured diameter of nanoparticles usually varies depending on the type of instrumentation used for respective measurements. For TEM and SEM, the samples must be small and must remain in high vacuum. Also, for TEM, the samples must be thin enough for electron transparency; as such the sample preparation involves tedious and time consuming steps. AFM imaging is also conducted only on small samples and is strictly a surface imaging technique. In this research, we utilized the terahertz technique as a nondestructive tool capable of non-contact probing and measuring both the size and size distribution of the nanoparticles. Especially, the technique gives one beneficial advantage compared to the AFM, SEM and TEM. It allows us not only to measure the photophysical properties of materials but also to determine the size dimension of some materials9,10 as well as spectroscopic analysis leading to unique identification capabilities.
Terahertz is the region of the electromagnetic spectrum lying between the microwave and the infrared red.11-13 Extensive research work has been carried out in the last couple of decades on the generation, detection and application of terahertz within this region.14-19 In this paper, Terahertz technique shows promise as a powerful tool for the size analysis of gold nanoparticles and especially as a nondestructive tool without sample size restrictions. Here, particles size of gold nanoparticles has been characterized using terahertz reconstructive imaging technique.20,21 Gold nanoparticles exhibit unique properties and have been extensively used in a myriad of applications including, imaging,22-24 drug delivery,25-27 diagnostics,28,29 therapeutics,28 sensing30-32 and catalysis.33,34 In all of these applications, the size of the nanoparticle plays an essential role in the effects they bring to bear. The mean diameter of the gold nanoparticles was also determined using DLS, TEM, FESEM and AFM. Additionally, the number of gold atoms was also calculated from the unit cell consideration. Gold has a face-centered cubic crystal structure; thus there are 4 gold atoms per unit cell (Figure 1). Since gold’s lattice parameter is 4.08 Å, its unit cell has a volume of 0.0679 nm3. Even though the unit cells of gold nanocrystals are cubic, gold nanoparticles themselves are pretty much spherical in shape. Knowing the size parameter of a given nanoparticle, the total number of atoms required to constitute each particle may be estimated. In what follows, we describe the results of gold nanoparticles’ sizes determined by various competing techniques. Then we demonstrate terahertz reconstructive imaging technique to measure the size of individual gold nanoparticles. We also estimate the number of gold atoms in a nanoparticle from the knowledge of gold crystals structure and the size of the nanoparticle.
Materials
All chemicals, reagents and solvents used for this report were of analytical grade and were used without further purification. Tetrachloroauric acid trihydrate (HAuCl4·3H2O) and trisodium citrate (C6H5Na3O7) were purchased from Electron Microscopy Services (Fort Washington, PA). The TEM carbon-coated 200 mesh copper grids were purchased from Ted Pella, Inc. (Redding, CA). Doubly purified deionized water from an 18 M Millipore system was used for aqueous solutions. All glassware used for GNPs syntheses was cleaned with freshly prepared aqua regia solution (3 parts HCl, 1 part HNO3) and rinsed with Milli-Q water (ρ > 18 MΩ).
Synthesis of gold nanoparticles
The gold nanoparticles solution was synthesized using a modified protocol reported elsewhere.35-37 The starting materials for the synthesis were gold salt and sodium citrate. A gold salt stock solution was prepared by dissolving 0.1g of gold salt in 10 mL of pure water. Separately, 5% citrate solution, equivalent to 0.17 M, was prepared by dissolving 0.5 g of sodium citrate in 10 mL of pure water. Part of the gold salt stock solution was further diluted to obtain 100 mL of 0.6 mM solution. In a flask equipped with a magnetic stir bar, the gold salt solution was brought to boil with continuous stirring. Next, 3 mL sodium citrate solution (ncitrate/nAu = 12) was quickly added to the gold salt solution and the mixture kept under continuous stirring for 20 min. During this period the color of solution changed from light yellow to dark grey, purple, and finally deep ruby red. The reaction was then stopped and the solution was cooled to room temperature. Subsequently, the sizes of the gold nanoparticles in this solution were determined using different techniques described below.
Characterizations
The size and morphology of the gold nanoparticles (GNPs) were analyzed using Transmission Electron Microscopy (TEM; JEM-1400 Plus) (JEOL USA, Peabody, Massachusetts). The images were viewed using Digital Micrograph software from (Gatan, Inc, Pleasanton, CA). The micrographs were analyzed using Origin software to obtain the mean size of the GNP cores (220 particles were measured) and their associated standard deviations were calculated. The hydrodynamic diameter and size distributions of the GNPs were determined using Dynamic Light Scattering (DLS) (HORIBA, Version LB-550 program). Absorption spectroscopy was carried out with UV-3600 Plus from Shimadzu, MD, USA.
Terahertz measurements
For terahertz multispectral imaging, the gold nanoparticles were dispersed in a solution. As outlined before, the GNP sample was dispersed in DI water at a concentration of 0.6 mM. This solution was further diluted for spin coating on a silicon wafer. That is, 0.58186 g of the above mentioned GNP solution in DI water was mixed with 0.37031 g of MeOH (reagent grade, Sigma-Aldrich). The resulting solution has a concentration of 0.38 mM (Assuming methanol has the same density as water: 1 mg/mL).This dilute solution was spun on a prime grade Si <100> wafer at a casting speed of 2000 rpm. A smooth film was obtained. Gold nanoparticles are known to agglomerate in to clusters in DI water. The mixed solvent of methanol-water is expected to disperse the nanoparticles better and help keep them from agglomerating. Therefore, we expect that terahertz imaging will reveal the individual particles rather than their agglomerated clusters.
UV-Vis spectroscopy
The above synthesized gold nanoparticles were first characterized by UV-Vis spectroscopy. Gold nanoparticles are known to exhibit strong absorbance in the visible region with wavelengths within the range of 500 nm to 600 nm depending on the size of the particles. It has also been shown that data obtain from UV-Vis measurement could be used to determine the size and concentration of gold nanoparticle.38 Figure 2 shows the UV-Vis spectra of the synthesized gold nanoparticles. The wavelength of maximum absorption was 528 nm consistent of the gold nanoparticles of the size obtained on from DLS. The size of gold nanoparticles was also estimated via UV-Vis spectroscopy according to equations for the computation of size of uncoated spherical gold nanoparticles in water from UV-Vis spectra.38 The equation is based on the ratio of the absorbance of gold nanoparticles at the surface Plasmon resonance peak to the absorbance at 450 nm. Based on this calculation, the mean diameter of the particles was determined to be 17 nm.
Dynamic light scattering
Dynamic Light Scattering measures the hydrodynamic diameter (HD) or the size of the particles in solution. Particle size obtained using from DLS measurement is usually bigger that those obtained from TEM and FESEM since the electron microscope provides an estimation of the particles in the dry state. Figure 3 shows the DLS measurement of the gold nanoparticles. The average size of gold nanoparticles as determine by DLS was 26.7 nm. The DLS measurement shows only one peak which is indicative of a homogenous or monodispersed gold nanoparticles in solution with negligible agglomeration. However, agglomeration may happen under storing conditions.
Transmission electron microscopy
The gold nanoparticles were further characterized by transmission electron microscopy. To carry out the TEM imaging, a drop of above-mentioned aqueous gold nanoparticle solution was dropped on a TEM grid and the sample allowed to dry overnight. Figure 4 shows a representative TEM image of the gold nanoparticles. The average size of the gold nanoparticles calculated from 220 particles was 16.62 nm with a standard deviation of ±4.73 nm (Figure 5). However, the overall sizes of the GNPs varied from ~8 nm to ~34 nm with a great majority of them lying between 12 nm and 20 nm. Thus, a small polydispersity is expected. The TEM image also shows that a few GNPs shape is not a perfect sphere; however, an aspect ratio was not established.
Terahertz reconstructive imaging
Terahertz measurements were carried out on an integrated terahertz time-domain nanoscanning spectrometer (Applied Research & Photonics, Harrisburg, PA 17111). A broadband multispectral terahertz source is used for continuous wave terahertz generation via dendrimer dipole excitation mechanism.39 The above mentioned Si wafer with the gold nanoparticles was mounted on the nanoscanner. The imaging measurements were done following the procedure outlined in previous reports.20,21 Briefly, a reconstructive imaging algorithm was applied on the data obtained by 3D rasterization of 3 µm3 volume of the gold nanoparticles on top of the Si wafer. It is assumed that the spin coating process will deposit the majority of the nanoparticles within the 3 µm depth of the film on top of the wafer.
Terahertz multispectral imaging and particle size analysis
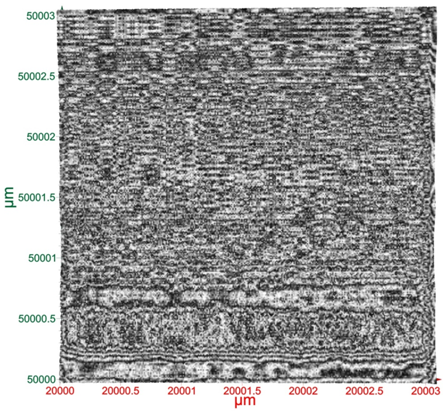
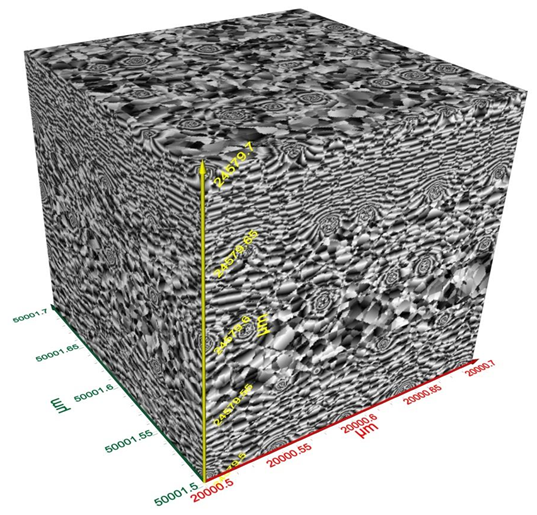
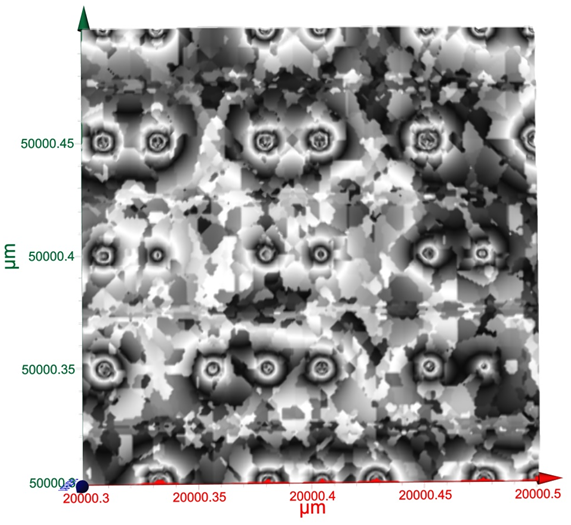
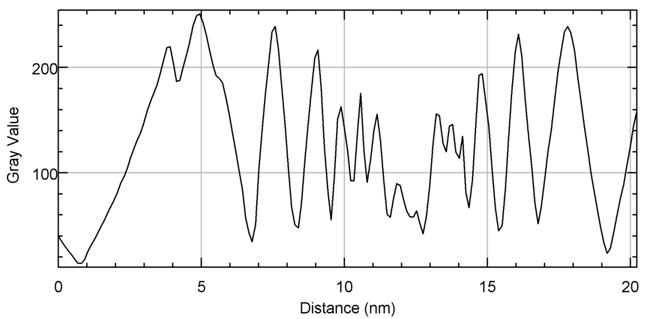
Terahertz multispectral reconstructive imaging was carried out for size estimate of the gold nanoparticles. Reconstructive imaging details have been described elsewhere.20,39 Figure 6 exhibits a surface image of 3 µm x 3 µm area of the aforementioned GNPs spun on Si<100>wafer. Short range order of the gold nanoparticles is expected from the spin coating process. Measurement was conducted on a layer by layer basis over 3 cubic micron volume. Figure 7 displays a 3D image of 200 cubic nanometer volume extracted from Figure 6. Similarly, Figure 8 shows the top surface of Figure 7 & Figure 9 shows a close up of two gold nanoparticles extracted from Figure 8. A graphical analysis of a nanoparticle from Figure 9 is shown in Figure 10 along the yellow line. This particle is ~18.5 nm in diameter with some fine structure visible in Figure 9 and also in the profile plot of Figure 10. In view of Figure 8, it seems reasonable to assume that not all particles are exactly of the same size, thus indicative of slight polydispersity. However, since Figure 8 is a single plane across the 3D image and not all GNPs are on the same plane, hence, some GNPs may appear of different size. But as was evident from the TEM image analysis, it is reasonable to assume that the present GNPs may possess light polydispersity. A summary of the gold nanoparticles’ sizes obtained via different techniques and their respective atomic constituents is enumerated in Table 1.
Calculation of number of atoms
It is apparent that the gold nanoparticles themselves are pretty much spherical in shape. Since the estimated diameter a gold nanoparticle of the present investigation is 18.5 nm, total volume of the nanoparticle is . Since the unit cell is a face centered cube with length parameter 0.408 nm, this yields the unit cell volume of 0.0679 cubic nm and thus, the number of unit cell in the nanoparticle = 48825.2. Thus the total number of gold atoms within this particular nanoparticle is ~195301.

Figure 6Surface image of 3 µm x 3 µm area of gold nanoparticles spun on Si wafer. Short range order of the gold nanoparticles is expected from the spin coating process. Measurement was conducted on 3 cubic micron volume.

Figure 7 Two hundred (200) cubic nanometer volume extracted from Figure 6. Nanoparticles are seen on the surface as well as scattered in the volume.

Figure 8 A surface area of two hundred nanometer square extracted form Figure 6. Close up of two gold nanoparticles from Fig. 5.

Figure 10 The nanoparticle on the right of Figure 9has a diameter ~18.5 nm. The fine structure within the particle is visible and may be quantified from Figure 10.
Technique |
Size (nm) |
Number of unit cells/atoms |
Comments |
TEM |
16.62 |
35401.5/141606 |
Size of dry GNPs on a copper grid |
DLS |
26.7 |
- |
Hydrodynamic diameter of GNPs in solution |
UV-VIS |
17.0 |
37885.7/151543 |
Via surface Plasmon resonance |
Terahertz |
18.5 |
48825.2/195301 |
Terahertz multispectral reconstructive imaging |
Table 1 Comparison of gold nanoparticles size obtained from various techniques
Gold nanoparticles were synthesized via the Frens-Turkevich method. These particles were characterized by UV-Vis, DLS, TEM, and also by terahertz 3Dmultispectral reconstructive imaging. It was found that the measured size varies between different techniques indicating some disagreements among various techniques. It is assumed that the variations in the particles measured sizes obtained using, UV-Vis, DLS, and TEM, is resulted from the variations of different parameters employed in the determination of particles size using those techniques. Especially, the terahertz reconstructive 3D imaging technique is capable of determining the size of individual gold nanoparticles more accurately compared to the UV-Vis and DLS. While the average size of the GNPs from TEM analysis was estimated to be (16.62 ± 4.73) nm, the terahertz technique yielded a size of 18.5 nm. Thus these two instruments produced results that are close to what was obtained from the UV-Vis spectroscopy (viz., 17.0 nm). The terahertz imaging technique also gives us more benefits as a nondestructive, non-contact route with sub-surface imaging capabilities. Taking advantage of the FCC crystal structure of gold, the number of unit cells in each gold nano`particle was computed, from which the number of gold atoms in each nanoparticle was estimated. This feature is useful for differentiating between different routes for GNP synthesis. The technique may also be deployed for other types of nanomaterials.
This work was partially supported by the University of Maryland System through Wilson E. Elkins Professorship grant (2485897), Constellation, an Exelon Company through E2- Energy to Educate grant program (163893), and Dept. of Education through SAFRA Title III Grant (2486005). The authors are also grateful to the Institution of Advancement, Coppin State University, for administrative help. The terahertz multispectral imaging was conducted at and supported by Applied Research & Photonics, Harrisburg, PA. The content is exclusively the responsibility of the authors and does not necessarily represent the official views of the funding agencies.
Author declares that there is no conflict of interest.

©2018 Rahman, et al. This is an open access article distributed under the terms of the, which permits unrestricted use, distribution, and build upon your work non-commercially.