International Journal of
eISSN: 2573-2838


Research Article Volume 6 Issue 1
Department of Electrical Engineering, State University of Santa Catarina, Brazil
Correspondence: Pedro Bertemes-Filho, Department of Electrical Engineering, State University of Santa Catarina, Joinville, Brazil
Received: January 29, 2020 | Published: February 26, 2020
Citation: Cavalieri R, Bertemes-Filho P. Plant tissue differentiation using electrical impedance spectroscopy with deep neural networks. Int J Biosen Bioelectron. 2020;6(1):20-23. DOI: 10.15406/ijbsbe.2020.06.00182
Electrical Impedance Spectroscopy (EIS) has been demonstrated as a powerful tool in the diagnosis of many different medical conditions. Using the interpretation of the information acquired by EIS it is possible to identify changes in the structure of biological tissue. Interpretation of EIS data is usually done by linear regression or mathematical modelling of the impedance curve. In this paper, a new method of classification of biological materials is developed using an Impedance Spectroscope and Deep Neural Networks for the interpretation of data. Results show that classification with neural networks is faster and more reliable than the usual approaches.
Keywords: electrical impedance spectroscopy, neural networks, deep learning, biological tissues
ANN, artificial neural network; BCC, basal cell carcinoma; CSV, comma- separated value; EIS, electrical impedance spectroscopy; MLP, multi-layer perceptron; SB, sepal bundle; ReLU, rectified linear unit
Electrical Impedance Spectroscopy (EIS) is a powerful tool for characterization of electrical properties of a wide range of materials.1 It has been demonstrated to reliably represent both organic and inorganic structures through the extraction of electrical parameters that serve as descriptors of the physiological state of biological tissues.2 Viable applications of EIS can be found in many different fields, ranging from the assessment of aging effects in lithium ion batteries3 to characterization of biological tissue, both from animal4 and plant5 origins. EIS in medicine have recently gained many different applications in the field since the minimally invasive characteristic of the procedure is very appealing for both patients and doctors. EIS has been used for the detection of malignant tumors in different organs such as the breasts,6 prostate7 and skin.8 In the application of characterization of biological tissue, excitation is usually provided by a current source with variable frequency between 10 Hz and 10 MHz. Analysis of impedance measurements in this range of frequency allows modelling of complex tissues as the association of passive electrical components.9 The most popular method for fitting EIS data into a mathematical equation is the Cole function,10 represented by
(1)
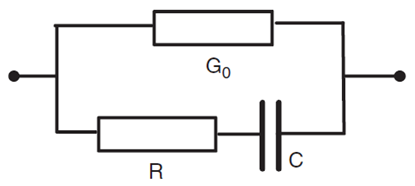
Where is the resistance value of the material at very high frequency, represents a Cole-type distribution of relaxation times for different kinds of tissue and electrical interfaces and stands for the specific relaxation time of the material being observed. Equation 1 is a mathematical characterization of the material being studied. Another possible way of representing this model would be with electric circuits, as shown in Figure 1 where the parallel conductance go stands for the intracellular content.1 One of the challenges imposed by the process of modelling EIS data is the fact that highly complex structures have to be simplified into elementary electrical models.2 Even if the circuits represent the biological system well enough, researchers must consider the fact that biological tissue and interfaces contain microscopic properties which vary amorphously throughout the sample. This makes it unlikely that the system can be represented by an electrical circuit, regardless of its dimensions and complexity.12

Figure 1 Method of representing biological tissue, where R represents the intracelluar resistance and C the cell equivalent capacitance.1
With the popularization of high-end processing units, Artificial Neural Networks (ANNs) started to gain traction as a viable alternative to interpreting biological data.13 Due to its inherent capacity to reproduce non-linear behaviour,14 ANNs can be considered a good alternative for modelling systems based on EIS data. In the past years, researches have used ANNs as a classification algorithm to interpret EIS data for medical diagnosis. In one study, researchers used this method for detection of basal cell carcinoma (BCC) with very high prediction rates.15 Another group used ANNs to estimate ischemia in biological tissues.16 This paper aims to develop an efficient framework for the differentiation of biological tissues using EIS and Neural Networks, establishing a coherent methodology from signal acquisition to data interpretation. The developed system prioritizes a time-efficient solution to this challenge and employs strategies for dimensionality reduction in order to maximize efficiency. The tissue chosen for classification is found in the perimedullary section of the common potato tuber, which is to be differentiated from the sepal bundle found in common apples. These were chosen based on structural and functional similarities, consisting mainly of parenchymatous cells of highly irregular size and shape. Also the availability of the samples enables the measurement process to be consistent. These characteristics ensure that classification is dependent on the correct characterization of the cellular composition of each tissue and that the same framework is capable to be repurposed for differentiation of other types of biological tissue.
The work presented in the paper involves the preparation of the biological material to be analyzed, extraction of EIS data, treatment of the collected data and the training of a deep neural network capable of classifying different tissues correctly.
Biological material samples
For this experiment the biological tissues selected were potato tuber (Solnnum tuberosum L.) as it is widely accepted as a good substitute for animal tissue17 and common apples (Malus domestica). Sample dimensions and electrode placement is determined in order to maximize EIS sensitivity in the deeper layers of measured tissue. Measurement is made by inserting 4 conductive needles (50mm in length, separated each by 80mm) into the sample. For the potato tuber, measurement is taken at the perimedullary section of the tissue as indicated in the right side of Figure 2. This is done in order to avoid irregularities in the EIS caused by skin or stem tissue and to increase the number of viable samples since this part of the tissue is the most prevalent in the anatomy of the plant. In the case of apples, measurement is taken into the sepal bundle, indicated in the left side of Figure 2 as SB. Like the perimedullary section of potato tuber, this is the most prevalent and uniform tissue observed in this species. Considering the large amount of data necessary for training and testing the classification network, measurement is repeated in 50 different samples for each type of tissue so the natural variations observed in the biological tissue can be taken into account by the algorithm.
Data acquisition
Equipment used for data acqusition is a HF12S Impedance Spectroscope manufactured by Zurich Instruments.
A tetrapolar electrode configuration is used in order to compensate for cable impedance. Voltage amplitude supplied to the sample is fixed at 10 Vp value ranging from 400 Hz to 1 MHz. A HF2TA current amplifier is used for amplification in the acquisition channel. Measurement is repeated in a consistent manner for all of the 100 samples of the different biological material prepared. Data collected is stored in a CSV file for later use.
Data preprocessing
Data preprocessing is made using the pandas Python library.20 As extracted from the HF12S spectroscope, the available data are (impedance in module), (phase angle) and (complex impedance) for each of the excitation frequencies. For this experiment only the curve observed by plotting the phase angle variation versus frequency is going to be used in classification. This is done in order to reduce the time and processing power required to perform training of the neural network while still maintaining reliability. Parametric fitting based on Gaussian least squares function21 is used in order to represent the phase angle by frequency curve in three dimensionless descriptors, further reducing dimensions. Each descriptor is represented by the Greek letters , and . These descriptors serve only to represent the phase angle difference between the two types of sample in a visual way which means that they have no defined physical meaning. Each feature is then scaled, ensuring that the mean value of the series over all samples is equal to and standard deviation between all values is equal to . This in turn maximizes effectiveness of the learning process of the Deep Neural Network.22
Deep neural network for tissue identification
Tissue identification is done through the use of a Deep Neural Network implemented through the Python library scikit-learn.23 Network architecture implemented is a multi-layer perceptron (MLP) with back propagation.
Solver used for weight optimization is L-BFGS with Rectified Linear Unit (ReLU) activation function. Learning rate is set at over hidden layers. Maximum iteration allowed is set to .
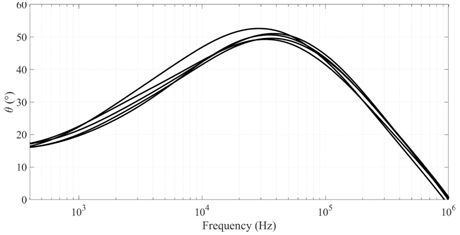
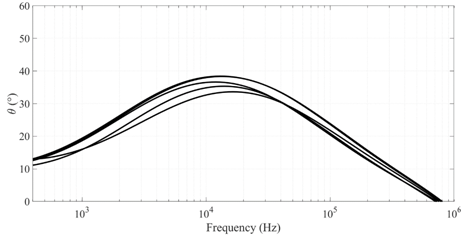
First type of result analyzed is the raw data acquired from the HF12S Spectroscope. As discussed previously, phase angle paired with the frequency applied to the sample was selected as the variable that would be used for classification of the tissue. This characteristic is directly tied to the structural composition of the sampled tissue and is considered a good descriptor of the electrical properties of biological materials. Figure 3 represent the phase angle in respect to frequency from 5 randomly chosen samples of each tissue. Differences between the characteristic curves of the two tissues as in respect to this variable are evident through graphical observation. Dimensionality reduction is applied in order to compress the phase angle which has dimensions (one for each frequency point gathered) into a 3 dimensional analysis, reducing the number of samples required for the supervised learning process of the classification neural network. Each curve is now a point in a 3 dimensional space and represented in Figure 4. Each axis in this representation have no physical meaning and serve only as a scale of differentiation and are named after the features extracted from the phase angle curve: , and . Also observable is the regularization used, ensuring that each feature ranges from ‒2 to . The visible separation between the two different types of samples in the three-dimensional space suggests that impedance spectroscopy is appropriately capturing the structural difference between tissues. It is also possible to infer from graphical analysis that the repeated measurements were taken adequately, since there are no observable outlier samples.


Figure 3 Impedance angle variation with frequency for 5 random samples of potato tuber (top) and apple (bottom).
Classification network converges around 200 iterations and achieves accuracy both in the training and validation data sets, the learning curve is shown in Figure 5. After the first round of training (200 iterations total), the neural network was able to classify correctly every sample preserved for testing. Convergence happens after at which point training is interrupted. Fast training speed can be attributed to the process of dimensionality reduction applied before training. In Figure 6 it is evident that the network learns quickly, rapidly reaching 100% precision. It is clear by the accuracy achieved by the classification network that the system developed is able to differentiate much more similar kinds of tissues. Which means that the methodology used can be used to solve more challenging tasks in tissue classification.
This study has shown that a neural network can reliably identify different plant-based biological tissues using data acquired by impedance spectroscopy. The accuracy of the network developed and the low required training time indicate that the methodology developed can be applied to more challenging tasks without compromising the systems feasibility. Future works should focus on the differentiation of multiple tissues (multi-class classification) or to study the structural alterations in biological tissues resulted from physical processes (drastic changes in temperature and pressure). In addition, the process described in this paper might be adapted to create classification models for ex-vivo animal tissues.
Funding for this research was provided by FAPESC (Fundação de Amparo à Pesquisa e Inovação do Estado de Santa Catarina) and UDESC (Universidade do Estado de Santa Catarina).
The authors declare that there are no conflicts of interest.

©2020 Cavalieri, et al. This is an open access article distributed under the terms of the, which permits unrestricted use, distribution, and build upon your work non-commercially.