International Journal of
eISSN: 2573-2838


Research Article Volume 4 Issue 1
Department of Mechanical Engineering, National Taiwan University, Taiwan
Correspondence: Rong-Huei Chen, National Taiwan University, Department of Mechanical Engineering, No 1, Sec 4, Roosevelt Rd, Taipei 10617, Taiwan, Tel +886-2-3366-3366
Received: February 01, 2018 | Published: February 12, 2018
Citation: Hsiao-Kan M, Rong-Huei C, Meng-Syuan D, et al. Design and evaluation of a highly-efficient miniature mixing system. Int J Biosen Bioelectron. 2018;4(1):11–18. DOI: 10.15406/ijbsbe.2018.04.00089
Mixing technologies are used widely in chemical and biological fields, and extensive research has been conducted to develop mixers for different levels of mixing rates and volumes. This paper reports a miniature mixing system constructed from a circular mixer and two miniature piezoelectric pumps. This system was designed to be easy to assemble and disposable. The circular mixer was based on a serpentine channel with a slit to perform the mixing process. The influence of different mixing chamber designs on the mixing efficiency of the system under a 12 ml/min flow rate was studied by simulation and experimental methods. The mixing process could be completed in 9 seconds using a 3 mm corner space, which shows the significance of the mixer. Both simulation and experimental results are presented and discussed, and the design criteria for an optimal mixer design are addressed as well.
Keywords: mixer, miniature mixing system, mixing chamber structure
With the increasing need for molecular reactions with small liquid volume in biomedical and chemical analyses, miniature mixers have captured considerable attention. Due to the nature of laminar flow in a millimeter-size and blow flow channel, mixing, or the molecular mass transfer in miniature mixers is usually dominated by molecular diffusion. The long diffusion time and mixing distance make rapid mixing unachievable. To address low mixing efficiency, various active or passive micro mixers have been proposed and examined.1-10 Miniature mixers can be divided into two types: active and passive. Active mixers are equipped with various driving sources based on different mechanisms to create fluctuations within the fluid to achieve high mixing efficiency.11-20 For example, Moctar et al.21 developed a mixer using electro-hydrodynamic force (EHD) to drive two types of fluids with different electrical properties. The two fluids were brought into contact in a channel and were optimized by controlling the Reynold number (Re) at 0.0174. Thus, mixing could be achieved in less than 0.1 sec within a short distance. Ahmed et al.22 studied an acoustically driven mixer with an air bubble trapped inside the mixing channel. The air-liquid interface could be excited to resonance by acoustic excitation to induce streaming for mixing; it took only a few milliseconds to complete the mixing process. Liu et al. studied a pulsed mixing method based on a Y-shaped micromixer driven by two piezoelectric micro-pumps. Using two out-of-phase sinusoidal waves, the contact area between two solutions could be increased. They successfully used this device to synthesize gold nanoparticles using HAuCl4 and Na3C6H5O7 solutions.23 A good synthesis was achieved with a Y-entrance angle of 60 degrees and flow rate of 4 ml/min. Passive mixers usually utilize molecular diffusion and chaotic advection.
The liquid flowing in traditional T-shaped and Y-shaped mixers is basically laminar flow, leading to long mixing distance and time due to weak molecular diffusion and strong advection (Pe >> 1). To enhance transverse advection, passive mixers with various complicated geometries have been developed, including the tesla micromixer,24 the zigzag micromixer,25 the split-and-recombine (SAR) micromixer,26 the slanted groove micromixer, and the curved channel micromixer.27-29 Schönfeld et al.30 & Li et al.31 designed and implemented different SAR micromixers. The special sub-channels in this type of mixer split the flow stream and destroy the laminar flow characteristics within the stream to increase the tendency of chaotic advection. Lynn and Dandy numerically studied a micromixer embedded with microgrooves and described the dependence of mixing efficiency on the channel aspect ratio, the groove depth ratio, and the ridge length32 By changing the geometric parameters of the mixing channel, the variation of the transverse advection flow can be as large as 50%. Nguyen33 & Jeong34 gave good reviews of mixer design and applications; their studies suggested that the geometric parameters and the flow rates are essential to the design of good mixers. In this study, a miniature mixing system is developed by combining a passive mixing chamber and two miniature pumps like that reported in our previous studies.35 A circular-shaped mixing chamber was adopted for easy assembly, with different mixing channels designed within the chamber to investigate the optimal mixing effectiveness. A simulation was conducted first to study the feasibility of the mixing system based on a serpentine channel structure and different corner space design within the flow channel. Experimental studies were conducted to verify the design. Finally, the method to optimize this design is discussed.
Design of miniature mixer chamber
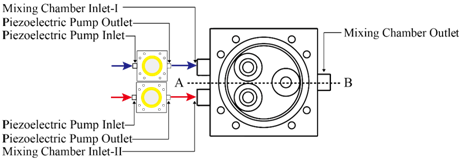
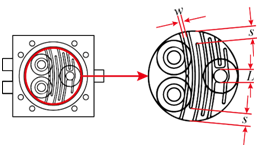
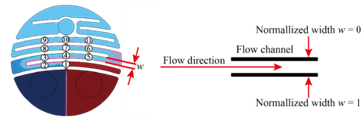
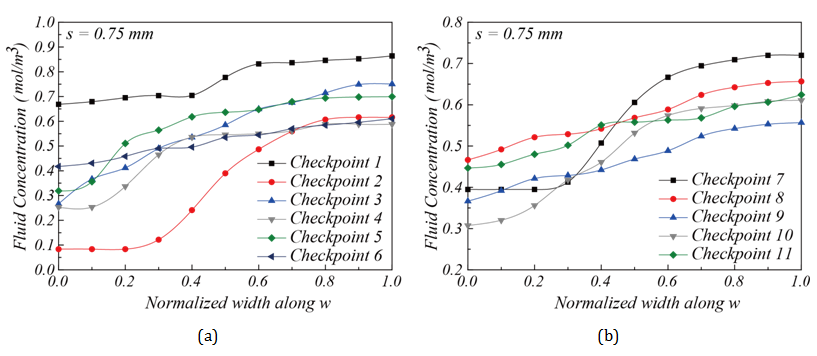
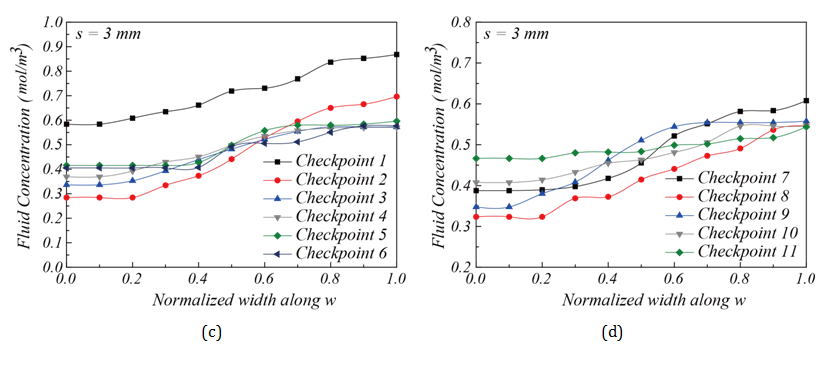
Figure 1 shows the configuration of the miniature mixer. The mixer chamber consists of a chamber body and a cover made of PMMA, an O-ring, and three silicone check valves. The PMMA device was fabricated by computer-numerical-controlled (CNC) machining. The dimensions of the mixer chamber are 50 mm by 50 mm by 12 mm. Check valves were made by machine punching from a 300-μm-thick silicone sheet. A commercially available 3-mm-thick silicone O-ring with an inner diameter of 36 mm was chosen to create an airtight seal between the cover and the mixer chamber. The chamber has an inner diameter of 34 mm and a chamber depth (d) of 0.45 mm. To explore the optimization directions of mixing efficiency, a series of serpentine channels and a slit were designed and fabricated. Figure 2 shows the proposed chamber structure designs. Figure 2A illustrates the top view of the mixing system. Figure 2B shows the top view and the cross-sectional view of the mixing chamber without inner structures. Figure 2C shows the top view and the cross-sectional view of the mixing chamber with flow channel design. Two design parameters, the channel width w and the corner space s at the first two turning corners within the flow channel, are specified in Figure 2D. The selection of the corner space dimension followed the study of Pradeep et al. 36. According to their findings, widening (double) or narrowing (half) of the channel width at the turning point can enhance mixing efficiency, while maintaining the same channel width at the turning point yields less efficient mixing. As the channel width w was fixed at 1.5 mm, the corner space s was set at 0.75 mm and 3 mm to investigate the influence of corner space dimensions on the mixing efficiency. A crossline L also was defined at the outlet of the mixing chamber in Figure 2D for the monitoring of the fluid concentration at the outlet to evaluate mixing efficiency. In addition, along the flow channel, 11 checkpoints were chosen to monitor the fluid concentration during the mixing process, as shown in Figure 2E.


Experimental setup
Figure 3 shows the experimental setup of the mixer system using the proposed mixer with the miniature piezoelectric pumps developed earlier by the authors.35 Two miniature pumps were driven by a 15 Hz, 60 Vpp sinusoidal driving voltage (Chroma 61501 Programmable AC Source) to yield a 12 ml/min flow rate at the outlet of the mixing chamber. Two working fluids (water) dyed red and blue were pumped into the mixing chamber by the two miniature pumps. The three pipes were connected to the inlets, and the outlet of the mixer was horizontally leveled to create zero backpressure in the mixing system. A Sony α7 high-speed camera was fixed on top of the transparent mixing chamber to capture the mixing process. The mixing chamber and miniature pumps were assembled in air, and the mixing chamber first was filled with the red fluid driven by one miniature pump before sending the blue fluid from the second pump to initiate the mixing process. For consistency, the same setup was applied to both simulations and experiments. All mixing experiments with different mixing chamber structure designs were conducted under the same conditions.
Numerical simulation
Finite element analysis:The 3D finite element model of the mixer was built using commercial COMSOL Multiphysics® software. According to Sayah et al.37 a two-step analysis can be used to simulate the mixing mechanism. The first step is to obtain the flow velocity vector field via the continuity equation Eq. (1) and Navier-Stokes equation Eq. (2):
(1)
(2)
where ρ is the fluid density, u is the flow velocity vector, μ is the fluid viscosity, and p is the pressure. To determine the spatial fluid concentration under a stationary condition, the velocity field is saved and applied in the convective mass-transport part of the convection-diffusion equation:
(3)
where D and C denote the diffusion coefficient and the concentration of the species, respectively. The boundary conditions were given as follows: (1) non-slip boundary condition on the channel wall, (2) half pulse flow with sinusoidal wave with 15 Hz, input introduced at each inlet, (3) laminar flow, (4) average flow velocity of 0.02 m/s, corresponding to 6 ml/min volume flow rate for each inlet, (5) zero outlet pressure, (6) total number of meshes set at 994,227, supported by the mesh convergence analysis shown in Figure 4, and (7) normalized concentration of 0 mol/m3 and 1 mol/m3 set for fluids at Inlet-I (navy blue color) and Inlet-II (dark red color), respectively. The ideal mixing result should be reaching the 0.5 mol/m3 concentration at the outlet. Diluted water solutions with color dyes were chosen as the working fluids. The dynamic viscosity and mass density of water at room temperature (25 °C) were 1×10⁻³ Pa·s and 998 kg/m3, respectively. The diffusion coefficient of the dye in water was first experimentally determined to be D = 1.537×10⁻⁹ m2/s (following33) before it was used in the simulation in this study.
Mixing performance
To describe the mixing performance along the mixing channel quantitatively and to compare the simulated and experimental results, top-view images of the fluid concentration profile of the mixing chambers were taken for both simulations and experiments. Following Ansari et al. and Afzal et al.38,39 the fluid concentration at any given point within the flow channel can be converted from the hue angle levelhi of the fluid color at each point/pixel on the top-view image using MATLAB. The hue angle level hi was defined between 0 and 1, with red assigned as 1 and blue assigned as 0. The color of the ideal mixed fluid should give a hue angle level of 0.5, corresponding to the fluid concentration of 0.5 mol/m3. The mixing performance can be evaluated by the mixing indices MP at the 11 checkpoints along the flow channel (defined in Section 2.1), which is defined as:
(6)
where is the standard deviation of the converted concentration at checkpoint i and is the largest among 11 . A higher MP value indicates a more homogeneously distributed concentration and better mixing performance from 0 (0%, not mixing) to 1 (100%, fully mixed).
Determination of the diffusion coefficient of the dyed fluid
In this study, the diffusion coefficient was determined first for simulation studies. A T-shaped device with a 15 mm × 2 mm × 0.5 mm flow channel connected to two entries was designed for this evaluation, as shown in Fig. 5. As the two dyed water solutions were considered highly diluted with both concentrations set at the same value of 5x10⁻⁴, the diffusion coefficients of the two dyed fluids can be assumed equal, regardless of the sizes of the dye molecules. Following the studies by Nguyen et al. & Galambos et al.33,34 the concentration change along the y-axis
perpendicular to the flow direction (x-axis) can determine the diffusion coefficient using the following equation:33
(7)
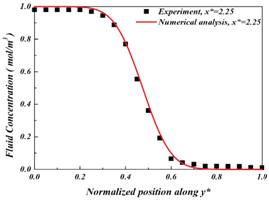
where c* is the dimensionless concentration distribution in the tube, x*= x/W, y* = y/W, are dimensionless coordinates with tube width w = 2 mm, Pe = UW/D is the Péclet number, and D is the target diffusion coefficient of the dyed fluid. The distribution of fluid concentration along the y direction was determined by the quantitative analysis described in Section 2.2 and is depicted by solid dots in Figure 6. For a givenx*, equation33 was used to fit concentration distribution along y* to yield the diffusion coefficient D under the best fit. Three x* were chosen: x* = 2. 25, x* = 3.25, x* = 5.25, to give three D values: 1.502 × 10⁻⁹ m2/s, 1.543 × 10⁻⁹ m2/s, and 1.567 × 10⁻⁹ m2/s, respectively, as shown in Figure 7A-7C. The average diffusion coefficient was then 1.537 × 10⁻⁹ m2/s, with 1.5% variation. This diffusion coefficient D = 1.537× 10⁻⁹ m2/s was used for the following simulation studies.


Simulation results
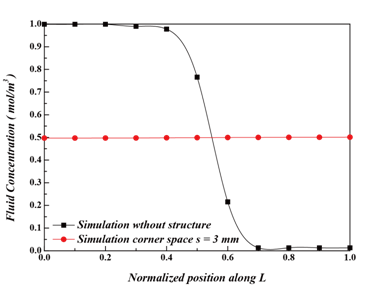
Mixing performance with and without flow channel structures: Figure 7 shows the simulation results of mixing chambers with and without flow channel structures. In Figure 7A, the two fluids flow directly towards the outlet of the mixing chamber in a chamber without mixing channels, resulting in limited time for contact and inducing incomplete mixing. In contrast, by deploying flow channels within the mixing chamber, a clear improvement can be seen, as the measured concentration was close to 0.5 mol/m2 at exit, as shown in Figure 7B & Figure 7C. To further examine the improved mixing performance, the fluid concentrations at the outlet were compared in Figure 8 for chambers without Figure 7A and with flow channel structure along the crossline L as shown in Figure 2. One can see that, for the mixing chamber without flow channel structure, the concentration distribution along L is 1.0 mol/m3 and 0.0 mol/m2 at the two ends with only minimal mixing in the middle of the outlet, as shown by the steep slope change in Figure 7A. From Figure 7C, for the mixing chamber with corner space s = 3 mm, the concentration distribution along L falls uniformly at 0.5 mol/m3. The introduction of flow channels within the mixing chamber increases the contact time between the two fluids and results in satisfactory mixing.
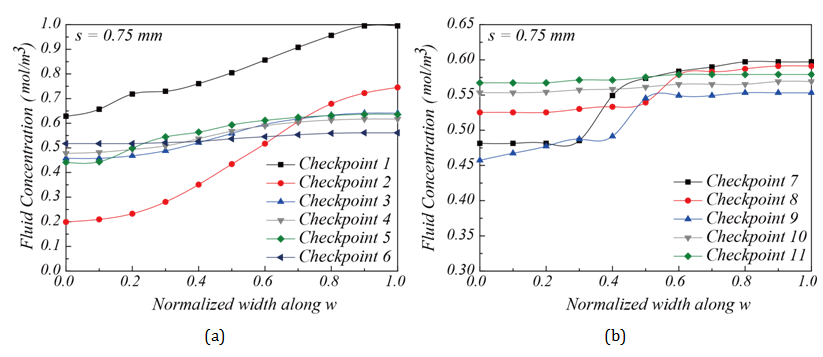
Influence of corner space design within flow channel on mixing efficiency: Two different corner space designs were studied in the flow channel structure. They are s = 0.75 mm and s = 3 mm, as shown in Figure 7B & Figure 7C. The concentration distributions shown in Figure 7B & Figure 7C suggest that the flow channel structure with s = 3 mm had better mixing performance than the one with s = 0.75 mm. This result was confirmed in Figure 9, as the fluid concentration distribution along L at the outlet for s = 3 mm falls perfectly at 0.5 mol/m3. The increased corner space creates an expanded channel width, thereby increasing the distance among fluid molecules. It gives more opportunities for molecules to diffuse through laminar flow layers, as discussed by Pradeep et al. 36. To further investigate the mixing progress between two fluids, the fluid concentrations were calculated using MATLAB to quantitatively analyze the concentration along the flow channel. Figure 10 shows the fluid concentrations at the 11 checkpoints along the flow channel towards the outlet Figure 2D. Figure 10A-10Dshow the concentration profile of the flow channels with s = 0.75 mm and s = 3 mm corner space. In Figure 10C & Figure 10D, for s = 3 mm, a clear improvement of fluid concentration towards 0.5 mol/m3 can be seen. A concentration profile near 0.5 mol/m3 at the outlet suggests that the channel design was sufficient for mixing. In summary, a chamber structure with serpentine channel design and corner space s = 3 mm was shown to provide optimal mixing performance in this study.
Experimental evaluation
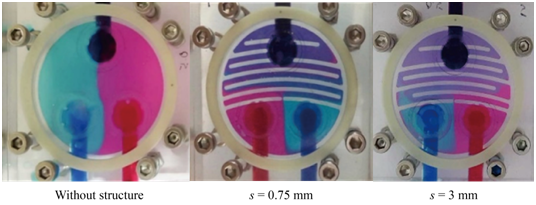
Comparison of the simulated and experimental result performance of fluid mixing at the outlet: To confirm the simulation results, mixer chambers with different interior structures, as shown in Figure 7A-7C, were fabricated and studied. The corresponding mixing results are shown in Figure 11A-11C. The fluid concentration at the outlet along L (defined in Figure 2C was measured and is shown in Figure 12. From Figure 12A-12C, one can see that the mixing chamber without flow channel design had minimal mixing at the outlet. The mixing chamber with flow channel and corner space s = 3 mm gave the best mixing result, and a concentration distribution range from 0.49 mol/m2 to 0.53 mol/m2 was achieved. The average concentration was 0.50 mol/m2 with a standard deviation of 0.007 mol/m2. The design with corner space s = 0.75 mm generated concentration distribution ranging from 0.52 mol/m2 to 0.63 mol/m2. The average concentration was 0.60 mol/m2 with a standard deviation of 0.024 mol/m2. As the mixing started with the mixing chamber filled with the 1 mol/m2 fluid, the mixing performance or efficiency of the mixer can be estimated by the concentration shift towards 0.5 mol/m2. Thus, the mixing efficiency of the mixer with s = 3 mm is estimated to be 15% better than the one with s = 0.75 mm.
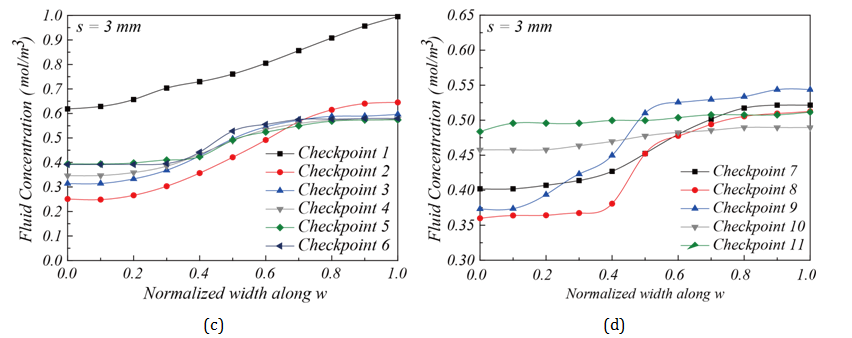
Experimental evaluation of the mixer performance along the flow channel: The mixing efficiency for chambers with corner space s = 0.75 mm and s = 3 mm can be compared further through concentration monitoring at the 11 checkpoints along the flow channel towards the outlet. Figure 13 gives the fluid concentrations at these checkpoints. The locations of these checkpoints and concentration measurements are similar to the simulation results shown in Figure 7 &Figure 10 & Figure 13A-13D show the concentration distributions for mixing chambers with corner space s = 0.75 mm and s = 3 mm. The chamber with s = 0.75 mm showed converging fluid concentration from Checkpoint 1 through Checkpoint 11 along the flow channel, but with 0.65 mol/m3 at Checkpoint 11 and the outlet, suggesting that the mixing is partially complete. On the other hand, the mixing chamber with corner space s = 3 mm showed much better mixing performance than the one with corner space s = 0.75 mm. A close-to-uniform (~ 0.5 mol/m3) concentration distribution at the outlet was achieved. Due to the highly uniform concentration distribution at the outlet Figure 12C, the mixer chamber with flow channel design and a corner space s = 3 mm was verified experimentally as a qualified mixer. Figure 14A & Figure 14B demonstrate simulation and experimental fluid mixing, which used chambers with different corner spaces s = 0.75 mm and s = 3 mm, respectively. Satisfactory mixing was achieved in 9 seconds by the mixing chamber structure with corner space s = 3 mm, as shown in Figure 14B ; the chamber with s = 0.75 mm did not display complete mixing within the 9-sec timeframe. This comparison confirms the simulation prediction on the increased diffusion phenomenon in the larger corner space within the flow channel. These results demonstrate the capability and effectiveness of this miniature mixing system.

Comparisons of the overall mixing performance of the simulation and experiment: To further compare the simulation results shown in Figure 10 and the experimental results shown in Figure 13, the mixing performance parameters MP Eq. (4) of the mixing chambers with different corner spaces were evaluated for both simulations and experiments, as shown in Figure 15 & Figure 15A-15B represent the MP evaluation for corner space s = 0.75 mm and s = 3 mm, respectively. The mixing performance of the mixing chamber with s = 3 mm is better than that with s = 0.75 mm. There was minimal difference between the simulation and the experimental results due to the function loss not being estimated.

This study proposed a miniature mixing system made of PMMA that is disposable and can be assembled easily with two external pumps, such as the two piezoelectric pumps we developed and presented in a previous paper.35 Based on our simulation and experimental studies, we conclude our findings as follows. In determination of the diffusion coefficient of the dyed fluid, the study adopted the equation proposed by Galambos et al.40 The diffusion coefficient of the color dyes used in this paper was 1.5 × 10⁻⁹ m2/s, and it was used for mixer simulation. A good match between the simulation and experimental results was found. In a mixing chamber without channels, incomplete mixing resulted. This was due to the limited time for the two fluids to have contact and the mixing process being based only on diffusion. In contrast, by deploying serpentine channels (s = 3 mm) within the mixing chamber, a clear improvement can be seen, with the measured concentration close to 0.5 mol/m3 at the outlet. Our studies suggest that a long flow channel length and appropriate corner spacing can yield highly satisfactory mixing performance. A mixing chamber with larger corner space (s = 3 mm) performed 15% better than one with smaller corner space (s = 0.75 mm), suggesting that the expansion of the turning corner spacing in the flow channel is positive for cross-diffusion between different dyed fluids. These results can provide guidelines for future mixer designs. This study used both simulations and experiments to examine the performance of the mixer system. Satisfactory mixing was achieved in 9 seconds, which is good for practical chemical and biomedical applications. Also, especially in the case of corner space s = 3 mm, the simulation successfully predicted the experimental results, suggesting that the parameter settings of the simulation can reflect real system conditions. This improves confidence in this study for simulation and design of more complicated fluidic systems. The simulation results were over predicted due to the emittance of function loss in the simulation. However, the trend of improved mixing along the flow channel in the case of corner space s = 3 mm indeed showed a better result, with MP value reaching 93 % at Checkpoint 11 in the experiment, as compared with the case of corner space s = 0.75 mm.
This research was funded by the Ministry of Economic Affairs, R.O.C. (103-EC-17-A-19-S1-225).
The author declares no conflict of interest.

©2018 Hsiao-Kan, et al. This is an open access article distributed under the terms of the, which permits unrestricted use, distribution, and build upon your work non-commercially.