eISSN: 2373-6372


Research Article Volume 5 Issue 2
1Hepatology & Gastroenterology Department, Mansoura University, Egypt
2Pathology Department, Mansoura University, Egypt
3Molecular Biology, Specialized Medical Hospital, Egypt
Correspondence: Shahira El-Etreby, Hepatology& Gastroenterology division, Specialized Medical Hospital, Faculty of Medicine, Mansoura University, Ghomhria street, Mansoura 35516, Egypt, Tel +2-114-3543995, Fax +2-50-2230287
Received: June 30, 2016 | Published: August 8, 2016
Citation: El-Etreby S, Bahgat M, Zalata K, Elkashef W, Samir W (2016) Fibrosis 4 Score Versus Hyaluronic Acid as Non-Invasive Tools for Assessment of HCV-Related Hepatic Fibrosis: Correlation with Quantitative Morphometric Analysis of Liver Biopsy. Gastroenterol Hepatol Open Access 5(2): 00134. DOI: 10.15406/ghoa.2016.05.00134
Background & Aims: Unlike the ordinal METAVIR system, morphometry can be used for quantitative assessment of hepatitis C virus (HCV)-related liver fibrosis. However, due to its invasive nature, we tried to study two non-invasive tools for this assessment, namely FIB-4 score and HA level.
Patients & methods: This study enrolled 99 chronic HCV patients with examination of their biopsy specimens by METAVIR system. Morphometry was performed by the fully automated Leica Qwin image processor and software 2004, Germany. Serum hyaluronic acid was measured using ELISA-based technique and FIB-4 score was calculated using Sterling’s formula.
Results: Fibrosis percentage quantified by morphometry increases as fibrosis advances. Also, it has significantly positive correlation with serum level of HA (r= .248, p=0.013), as well as FIB4-score (r=.481, p< 0.0001). The cut off values of morphometry fibrosis percentage, FIB-4 score, and HA level for diagnosis of advanced fibrosis (F≥3) are 8.35%, 1.63, and 46.5ng/ml, respectively. Their diagnostic accuracy has AUC of 0.88, 0.91, & 0.73, respectively. Their sensitivity and specificity are 83% & 91% for morphometry, 83% & 90% for Fib-4 score, and 67% & 85% for HA level. Sensitivities of morphometry and FIB-4 score were not significantly different (p=0.549) while both were significantly better than that of HA (p=0.003 and 0.015, respectively).
Conclusion: Morphometry is a precise tool for measuring advanced hepatic fibrosis. Although there was significant positive correlation between morphometry fibrosis percent, serum hyaluronic acid level and FIB-4 score, both morphometry and FIB-4 score were better diagnostic tests for advanced fibrosis than HA.
Keywords: chronic hepatitis c, morphometry, fib-4 score, hyaluronic acid, liver fibrosis, metavir score
HCV, hepatitis c virus; FIB-4, fibrosis 4 score; HA, hyaluronic acid; CPA, collagen proportionate area; ECM, extracellular matrix; MMPs, matrix metalloproteinases; TIMPs, metalloproteinases; DIA, digital image analysis
Human liver normally contains approximately 2% of collagen (5.5mg/g),1 and this collagen proportionate area (CPA) increases to about 25% (30mg/g) in liver cirrhosis related to hepatitis C virus,2 as a consequence of sustained healing by fibrosis in response to chronic injury.3
Fibrosis is a dynamic process that results from simultaneous abnormality in both synthetic and degradation processes. In the fibrotic state, there is excessive synthesis of extracellular matrix (ECM)4,5 that reaches approximately 6-fold in advanced fibrosis stages than that in normal liver, including collagens (types I, III, and IV), fibronectin, laminin, hyaluronan, proteoglycans, undulin as well as elastin. Meanwhile, ECM degradation by matrix metalloproteinases (MMPs) is inhibited in liver fibrosis due to over expression of tissue inhibitors of metalloproteinases (TIMPs).6
Assessing hepatic fibrosis in chronic HCV is very important, both for diagnostic and prognostic purposes.7 Liver biopsy is still considered as the gold standard test for this assessment despite several limitations including sampling error, under-staging, and inter-observer variability in interpretation.2,8,9 Moreover, all available fibrosis staging systems incorporate an ordinal description of architectural changes rather than the quantitative changes in liver collagen10 which seems important in assessment of anti-fibrotic property of different management strategies.
Morphometry (or measurement of form) seems promising in this quantitative assessment of liver collagen. In 1969, Weibel, who was one of the main promoters of morphometry, defined the term as the quantitative description of macroscopic or microscopic structure. As such, morphometry is expected to be objective, reproducible, and more accurate in detecting subtle changes in a specimen.11
Therefore, our study was conducted to compare the performance of two fibrosis indices, Fibrosis 4 score and hyaluronic acid in the non-invasive diagnosis of hepatic fibrosis and to correlate their results with the quantitative morphometric analysis of liver biopsy specimens.
The study protocol was approved by Mansoura Medical Research Ethics Committee (MMREC), Faculty of Medicine, Mansoura University. Ninety nine patients (75 males and 24 females), with mean age of 38.4±10.7 years were enrolled in this study. All patients were diagnosed with chronic HCV and histopathological proof of hepatic fibrosis using METAVIR scoring system.
Liver biopsy
According to 2009 APASL consensus recommendations,12 percutaneous liver biopsy was performed using liver biopsy needle of 16G. Core length was considered adequate if it is ≥10-15mm provided that it contains a minimum of ten portal tracts. A second pass was done immediately if the biopsy core length<10mm.
The collected specimens were fixed in formalin & embedded in paraffin. Two hepatopathologist experienced in METAVIR system thoroughly examined these specimens using H & E stain, PSA diastase, Masson Trichrome, and Prussian blue. The report included staging of fibrosis and grading of necro-inflammation (Figure 1)13 as well as steatosis14 and tissue iron overload if present. Inadequate biopsy specimens were excluded from the study.
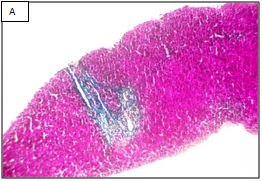
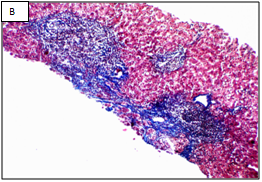
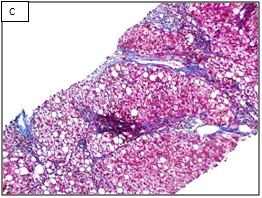
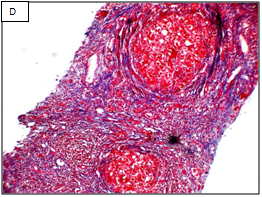
Figure 1 Different stages of liver fibrosis by METAVIR.
A: Stage F1. Expansion of portal tracts by fibrosis without bridging (Masson Trichrom stain, 100x). B: Stage F2. Expansion of portal tracts by fibrosis with occasional portal-portal bridging (Masson Trichrom stain, 100x). C: Stage F3. Expansion of portal tracts by fibrosis with neumerous portal-portal bridging (Masson Trichrom stain, 100x). D: Stage F4. Loss of normal liver architecture and replacement by cirrhotic nodules (Masson Trichrom stain, 100x).
A: Stage F1. Expansion of portal tracts by fibrosis without bridging (Masson Trichrom stain, 100x). B: Stage F2. Expansion of portal tracts by fibrosis with occasional portal-portal bridging (Masson Trichrom stain, 100x). C: Stage F3. Expansion of portal tracts by fibrosis with neumerous portal-portal bridging (Masson Trichrom stain, 100x). D: Stage F4. Loss of normal liver architecture and replacement by cirrhotic nodules (Masson Trichrom stain, 100x).
Cohen’s kappa (Cohen’s k) was run to determine the degree of agreement between the two pathologists´ on METAVIR fibrosis stage on 114 biopsy specimens. There was good agreement between the two pathologists´ judgments, k=0.770 (95% CI, 0.668 to 0.872, p< 0.0001). The two pathologists agreed on total 99 biopsies, 65 biopsy as stage F1, 16 as F2, 16 as F3, and 2 as F4. However, pathologist B diagnosed 3 as F1 when pathologist A diagnosed them as F2. Also, pathologist B diagnosed 6 as F2 when pathologist A diagnosed 4 of them as F1 and 2 of them as F3. He also diagnosed 2 as F3 when pathologist A diagnosed one of them as F2 and the other one as F4. Finally, he diagnosed 4 as F4 when pathologist 1 diagnosed them as F3.
Morphometric assessment of hepatic fibrosis
Morphometry was performed with a fully automated Leica image processor and software (Leica Qwin software, Wetzlar, D-35578, Germany, 2004). The biopsy slides were placed on the x-y motorized stage of a Leica microscope after staining with Sirius red. Automated, sequential and digitalized images were taken by magnification and stored. A mosaic picture was then created by incorporating all images at the same time. Finally, the created picture was converted into a binary image after eliminating any artifact through automatic and/or interactive techniques. Percent of fibrosis was measured as the fraction of area occupied by fibrosis within the reference area of liver parenchyma (Figure 2).15
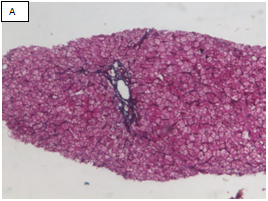
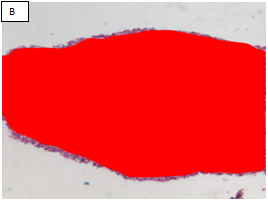
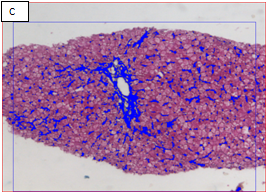
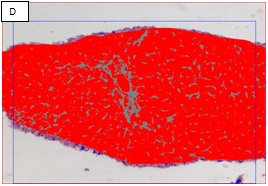
Figure 2 Chronic hepatitis stage 1/4 by the METAVIR scoring system (Masson’s trichrome stain, x100).
A: The portal area showed expansion of fibrous tissue. B: Delineation of the whole core by the software. C: Binary image of the fibrous tissue in the portal areas well in sinusoids (sinusoida wall fibrosis) taken by an interactive method using an image analysis system with area morphometry software. D: This image shows both the delineated fibrosis with the delineated whole core.
Measurement of serum hyaluronic acid (HA)
Serum HA level was measured by an enzyme-linked assay that uses hyaluronic acid binding protein (HABP) which acts as a specific receptor for HA that links, in vivo, HA with core-protein and other glycosaminoglycans to form complexes of proteoglycan aggregates. Diluted patient serum or plasma samples are incubated in the wells, allowing any available HA to bind to the immobilized HABP. Bound conjugated HABP is incubated with a substrate/chromophore system. The final color development is measured spectrophotometrically in optical density units (OD units). The sensitivity of this test was 0.38pmol/ml with no known cross-reactivity.16
Fibrosis 4 (FIB 4) score calculation
The Fibrosis-4 score estimates the amount of scarring in the liver through the following equation.
FIB−4=Age (in years)×Aspartate aminotransferase (in U/L)Platelet count (in 109/L) ×
√Alanine aminotransferase(in U/L)MathType@MTEF@5@5@+=feaagKart1ev2aaatCvAUfeBSjuyZL2yd9gzLbvyNv2CaerbuLwBLnhiov2DGi1BTfMBaeXatLxBI9gBaerbd9wDYLwzYbItLDharqqtubsr4rNCHbGeaGqiVu0Je9sqqrpepC0xbbL8F4rqqrFfpeea0xe9Lq=Jc9vqaqpepm0xbba9pwe9Q8fs0=yqaqpepae9pg0FirpepeKkFr0xfr=xfr=xb9adbaqaaeGaciGaaiaabeqaamaabaabaaGcbaqcfaOaamOraiaadMeacaWGcbGaeyOeI0IaaGinaiabg2da9maalaaabaaeaaaaaaaaa8qacaWGbbGaam4zaiaadwgacaGGGcWaaeWaa8aabaWdbiaadMgacaWGUbGaaiiOaiaadMhacaWGLbGaamyyaiaadkhacaWGZbaacaGLOaGaayzkaaGaey41aqRaamyqaiaadohacaWGWbGaamyyaiaadkhacaWG0bGaamyyaiaadshacaWGLbGaaiiOaiaadggacaWGTbGaamyAaiaad6gacaWGVbGaamiDaiaadkhacaWGHbGaamOBaiaadohacaWGMbGaamyzaiaadkhacaWGHbGaam4CaiaadwgacaGGGcWaaeWaa8aabaWdbiaadMgacaWGUbGaaiiOaiaadwfacaGGVaGaamitaaGaayjkaiaawMcaaaWdaeaapeGaamiuaiaadYgacaWGHbGaamiDaiaadwgacaWGSbGaamyzaiaadshacaGGGcGaam4yaiaad+gacaWG1bGaamOBaiaadshacaGGGcWaaeWaa8aabaWdbiaadMgacaWGUbGaaiiOaiaaigdacaaIWaWdamaaCaaabeqcfasaa8qacaaI5aaaaKqbakaac+cacaWGmbaacaGLOaGaayzkaaGaaiiOaiabgEna0oaakaaapaqaa8qacaWGbbGaamiBaiaadggacaWGUbGaamyAaiaad6gacaWGLbGaaiiOaiaadggacaWGTbGaamyAaiaad6gacaWGVbGaamiDaiaadkhacaWGHbGaamOBaiaadohacaWGMbGaamyzaiaadkhacaWGHbGaam4Caiaadwgaaeqaamaabmaapaqaa8qacaWGPbGaamOBaiaacckacaWGvbGaai4laiaadYeaaiaawIcacaGLPaaaaaaaaa@A495@
According to Sterling et al.,17 a score of less than 1.45 had a negative predictive value (NPV) of 90% for advanced fibrosis. In contrast, a FIB-4 more than 3.25 would have 97% specificity and a 65% positive predictive value (PPV) for advanced fibrosis. So, liver biopsy can be avoided in patients with values <1.45 or >3.25 with overall accuracy of 86%.
Statistical analysis
Data were collected, then entered and analyzed with SPSS software version 17 (SPSS inc, IL Chicago). Categorical (qualitative) data were expressed as number (and percent) and were compared by Chi-square test (or Fisher’s exact test). Quantitative (metric) data were expressed as mean +/- SD if normally distributed or median if not and were compared by independent samples t-test for two groups or one way ANOVA test for more than two groups if normally distributed or using the alternative nonparametric tests if not (Mann Whitney test for two groups, and Kruskal Wallis test for more than two groups). Post-hoc test (LSD) was used if one way ANOVA showed significant difference between 3 or more groups to detect where this difference exists. For diagnostic accuracy of qualitative tests, Receiver Operating Characteristics (ROC) curve was performed to detect the cutoff with best sensitivity and specificity. Statistical significance is achieved when p value is <0.05. Medcalc (version 15.2) was used to calculate weighted Kappa (linear weights) to determine the degree of agreement between the two pathologists in diagnosing the ordinal stage of fibrosis by METAVIR system.
Patient’s clinical and laboratory characteristics were illustrated in Table 1. In addition, IHA for Bilharziasis was positive in 54 patients (54.54%). Histopathological examination was shown in Table 2, steatosis was macrovesicular in 35 patients, microvesicular in 2 patients, and mixed pattern in 3 patients.
Characteristic (n= 99) |
Mean ± SD |
BMI(kg/m2) |
27.78±4.06 |
S. albumin (gm/dl) |
4.48±0.39 |
ALT (IU/L) |
64.13±51.29 |
AST (IU/L) |
56.08±44.55 |
S. bilirubin (mg/dl) |
0.79±0.37 |
Alkaline phosphatase (U/L) |
46.71±46.10 |
INR |
1.04±0.16 |
CBC |
|
Hemoglobin (gm/dl) |
14.11±1.52 |
Platelets count (/cmm3) |
212.17±62.90 |
WBCs (/cmm3) |
6.59±1.76 |
RT PCR RNA HCV (x 109IU/ml) |
1.36±1.94 |
S. creatinine (mg/dl) |
0.83±0.22 |
S. glucose (mg/dl) |
100.80±47.97 |
TSH (uIU/ml) |
1.48±1.11 |
AFP (ng/ml) |
8.56±16.14 |
Ferritin (ng/dl) |
124.66±109.40 |
Hyaluronic acid (ng/ml) |
46.71±91.31 |
Table 1 Patients' characteristic and laboratory investigations
|
N (%) |
MEATVIR score |
|
Fibrosis Stage |
|
F1 |
65(65.7%) |
F2 |
16(16.2%) |
F3 |
16(16.2%) |
F4 |
2(2%) |
Activity grades |
|
A1 |
48(48.5%) |
A2 |
42(42.4%) |
A3 |
9(9.1%) |
Steatosis |
|
0 |
61(61.6%) |
1 |
1(1%) |
2 |
23(23.2%) |
3 |
12(12.1%) |
4 |
2(2%) |
Macrovesicular |
|
No |
64(64.6%) |
Yes |
35(35.4%) |
Microvesicular |
|
No |
94(94.9%) |
Yes |
5(5.1%) |
Table 2 Semi-quantitative histological parameters of the studied population
Steatosis NAS 4 if associated with steatohepatitis. Table 3, shows that the percentage of fibrosis in the core tissue of liver biopsy as determined by digital image analysis of morphometry (Figure 3), and the level of hyaluronic acid were increased as the fibrosis advance. FIB-4 score was increased in both stage of F3 and F4 but higher level was noticed in F3. Further analysis using Mann-Whitney U tests revealed a statistically significant difference in morphometric results in differentiating between F1 & F2 (Z=-4.44, p<0.0001), F1 & F3 (Z=-5.13, p<0.0001), and F2 & F3-4 (Z=-3.038, p=0.002).
|
Morphometric Fibrosis Area Percentage |
|||||
Stage of Fibrosis |
Minimum |
Maximum |
Median |
Means±SD |
95% Confidence Interval |
|
Lower Bound |
Upper Bound |
|||||
1 |
0.1 |
8.6 |
2.20 |
2.68±1.75 |
2.25 |
3.12 |
2 |
1.5 |
13.4 |
5.95 |
6.756±3.61 |
4.83 |
8.68 |
3 |
1 |
47 |
12.60 |
14.31±10.70 |
8.60 |
20.02 |
4 |
34.2 |
47 |
40.6 |
40.60±9.05 |
|
|
FIB-4 score |
||||||
1 |
0.31 |
3.53 |
0.74 |
0.93±0.54 |
0.79 |
1.06 |
2 |
0.43 |
4.58 |
1.34 |
1.69±1.17 |
1.11 |
2.26 |
3 |
0.91 |
9.04 |
3.94 |
3.78±2.32 |
2.54 |
5. 02 |
4 |
1.81 |
3.20 |
2.51 |
2.51±0.97 |
|
|
Hyaluronic acid level |
||||||
1 |
1 |
83 |
30 |
30.12±21.35 |
24.83 |
35.42 |
2 |
10 |
80 |
42.50 |
45.18±19.63 |
34.72 |
55.64 |
3 |
1 |
104 |
49.50 |
54.56±32.18 |
37.71 |
71.71 |
4 |
35 |
105 |
70 |
70±49.49 |
|
|
Table 3 Measurement of morphometric fibrosis percentage, hyaluronic acid level, FIB-4 score in different fibrosis stages assessed by METVIR system
In diagnosis of advanced fibrosis (stage ≥F3), the accuracy of quantitative assessment of hepatic fibrosis percentage by morphmetry was high, with AUC of 0.879 (Figure 4), cutoff value of 8.35%, sensitivity of 83% and specificity of 91%. Also, FIB-4 score by either our cutoff or previously published one achieved high specificity values of 90%, and 96.29 %, respectively. In addition, with cutoff value of 46.5ng/ml, hyaluronic acid could rule out presence of advanced fibrosis by NPV of 92% (Table 4). Comparison of the independent ROC curves (AUC) for hyaluronic acid, FIB-4 score and fibrosis percent by morphometry in diagnosis of advanced fibrosis (METAVIR F3-4) were statistically significant only when comparing hyaluronic acid against FIB-4 score (p=0.03) while other comparisons (hyaluronic acid as well as FIB-4 score against fibrosis percent by morphometry) were statistically insignificant (p=0.14 and 0.66 respectively).

Figure 4 Receiver Operating Characteristics ROC curves of morphometry, FIB-4 score and hyaluronic acid in relation to METAVIR stage ≥ F3.
|
% of Fibrosis by Morphometry |
FIB-4 Score |
Hyaluronic Acid Level |
|
Our score |
Published score |
|||
AUROC |
0.879 (0.748-1) |
0.913(0.841-0.985) |
0.85 (0.82-0.89) |
0.73(0.581-0.879) |
Cutoff |
8.35 |
1.631 |
3.25 |
46.5 |
Sensitivity (%) |
83 |
83 |
50 |
67 |
Specificity (%) |
91 |
90 |
96.29 |
85 |
PPV (%) |
61 |
65.22 |
75 |
50 |
NPV (%) |
97.3 |
96.05 |
89.65 |
92 |
Table 4 Diagnostic accuracy of morphometry, hyaluronic acid level, and FIB-4 score in diagnosis of advanced fibrosis (METAVIR F≥3)
Table 5 shows there was statistically significant positive correlation between fibrosis percent (as measured by morphometry) and AST, ALT, INR, HA level, FIB4 score, fibrosis stage, activity grade, and presence of steatosis (p values are 0.0001, 0.0001, 0.003, 0.013, 0.0001, 0.0001, 0.0001, and 0.0001 respectively). On the other hand, there was statistically significant negative correlation between fibrosis percent (as measured by morphometry) and serum albumin level (p=0.0001). Figure 5 a & b shows that there was significant increase in both hyaluronic acid level and FIB-4 score as the fibrosis stage advances.
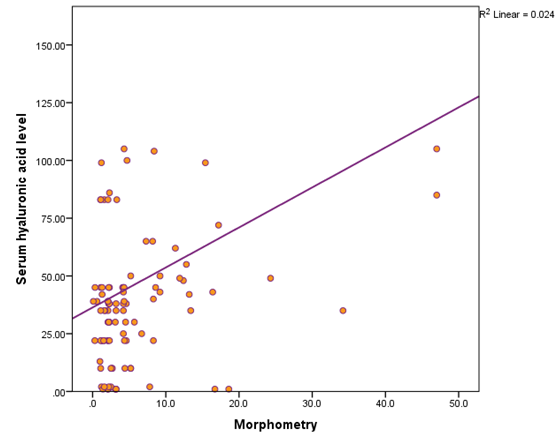
Figure 5a Shows the positive correlation between serum level of hyaluronic acid and percentage of fibrosis by morphometry.
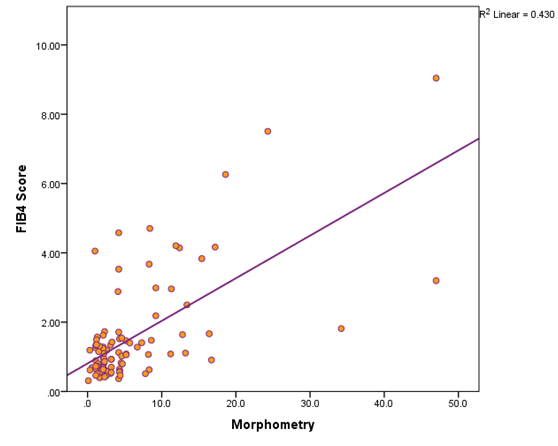
Figure 5b Shows the positive correlation between serum level of FIB-4 score and percentage of fibrosis by morphometry.
Parameter |
Correlation Coefficient |
p Value |
Age |
.156 |
0.124 |
Sex |
-.049 |
0.631 |
BMI |
.09 |
0.378 |
Albumin |
-.389 |
0.0001 |
ALT |
.571 |
0.0001 |
AST |
.728 |
0.0001 |
S. bilirubin |
.154 |
0.131 |
INR |
.292 |
0.003 |
RT PCR HCV |
-.117 |
0.25 |
Hyaluronic acid level |
0.248 |
0.013 |
FIB-4 score |
0.481 |
0.0001 |
Fibrosis stage |
.733 |
0.0001 |
Activity grade |
.526 |
0.0001 |
Presence of steatosis |
.351 |
0.0001 |
Table 5 Correlation between fibrosis percent by morphometry and different clinical, laboratory, and histopathological parameters
Assessment of hepatic fibrosis poses both diagnostic and prognostic values. However, there are increasing limitations in using the current scoring systems when examining biopsy specimens7 mainly because all systems incorporate an ordinal (categorical) description of architectural changes, without reference to quantitative changes in liver collagen as liver disease stage progresses or regresses. Moreover, routine histological evaluation of fibrosis is often performed with the general connective tissue stains, trichrome or reticulin. Hence, the amount of trichrome or reticulin staining does not necessarily correlate well with the amount of hepatic collagen.18
In our study, hepatic histology was scored according to METAVIR system, and hepatic collagen content was quantified by digital image analysis (DIA) morphometry. There is an overall positive correlation between fibrosis percentage detected by morphometry and the ordinal score with statistical significance at p value of less than 0.0001, these are in agreement with other studies.19–22 In addition, morphometry could be considered a good, sensitive tool in quantitation of advanced liver fibrosis with high sensitivity and specificity (83% and 91%, respectively).
Accurate morphometric studies require high quality specimens which are not fragmented and of adequate size, because fibrous tissue is under represented in small, fragmented specimens of fibrotic livers.23 Therefore, biopsy specimen that did not meet these criteria was excluded.
DIA utilizes segmentation of digital images to measure a “fibrosis ratio” or CPA by dividing fibrosis area by tissue area. This does not hinder the other evaluations necessary for routine diagnosis. So, it can be used as a promising adjuvant tool for precise determination of the exact fibrosis percentage and regression or stability of fibrosis stage after management of chronic HCV especially in the new era of direct acting antiviral therapies that are endorsed in the new guidelines of HCV therapy.
Practically, this technique has seldom been used clinically. Goodman et al.,24 examined liver biopsy specimens from 245 patients with treatment-refractory chronic hepatitis C before and after treatment with interferon α-1b. Morphometry was found to be more sensitive than histological staging in diagnosing fibrosis progression. Several studies postulate that morphometry is a reproducible, can detect early as well as advanced fibrosis or cirrhosis, and more precise for monitoring fibrosis progression or regression during clinical therapeutic trials.25–27
Egypt has the highest prevalence of HCV and after endorsing the use of direct oral antiviral drug, there is increased need for a serum biomarker that could assess the stage of liver fibrosis by an acceptable degree so that, we can restrict liver biopsy to special situations, namely if there is doubt about pathology, if there is an associated condition or to assess degree of fibrosis regression.
Hyaluronic acid (HA) is a major extracellular matrix component, a non-sulfated glycosaminoglycan composed of repeating polymeric disaccharides D-glucuronic acid and N-acetyl-D glucosamine linked a glucuronidic b (1-3) bond. The accumulation of HA can result as a consequence of activated hepatic stellate cell production or reduced hepatic sinusoidal endothelial cell clearance.28 Several studies supports that HA level and FIB-4 score may be clinically useful as a non-invasive marker for liver fibrosis and/or cirrhosis.29–37
The current study confirmed the previous concept of the presence of positive correlation between serum hyaluronic acid, FIB-4 score and collagen content in the liver as quantified by digital imaging morphometry.
FIB4 score seems a promising non-invasive tool for diagnosis of advanced hepatic fibrosis as evidenced by comparing its ROC curve AUC against those for HA level and morphometric fibrosis percent. This way, it can be used to replace the invasive liver biopsy with considerable accuracy.
However, it should be kept in mind that the serum biomarkers usually reflect an ‘active’ process of fibrogenesis or fibrolysis rather than the ‘static’ amount of collagen accumulated in the liver. In addition, serum HA increases in different medical situations as rheumatoid arthritis and renal insufficiency, however both conditions were within our exclusion criteria.
The major limitation of the study was the limited number of patients investigated with METAVIR score F3 (n=16) and F4 (n=2). This small sample size was ascribed to the limitation of HCV therapy at the time of the study according to our National Committee for Control of Viral Hepatitis (NCCVH) guidelines to early stages of fibrosis as assessed by METAVIR system. Currently, we are performing a validation study on a larger number of patients.
Regarding the cost of each diagnostic test, Liver biopsy with METAVIR system costs 45 USD per case, liver biopsy with morphometry costs 39.5 USD per case, Fibroscan costs 28.2 USD per case, and HA research kits costs 9 USD per case.
Based on these findings, we would suggest that liver biopsy should be restricted only to those with higher (>1.63) FIB-4 score. In that regards, we also suggest using the morphometric assessment instead of METAVIR score because of the advantage of the continuous rather than the semi-quantitative scale of evaluation?
Morphometric image analysis can be considered as a more precise measurement tool of hepatic fibrosis being expressed on a continuous scale rather than the ordinal (semiquantitative) scoring system of METAVIR. In addition, morphometry correlated well with the serum fibrosis markers, hyaluronic acid and FIB-4 score. However, both morphometry and FIB-4 score were better diagnostic tests for advanced fibrosis than HA.
This work was funded by Science Technology Developmental Fund (STDF) grant, under call named, TC/2/Health/2010/hep-1.6:diagnostic imaging for accurate diagnosis and staging of the disease, project number 3512.
The authors who have taken part in this study declared that they do not have anything to disclose regarding funding or conflict of interest with respect to this manuscript.
None.

©2016 El-Etreby, et al. This is an open access article distributed under the terms of the, which permits unrestricted use, distribution, and build upon your work non-commercially.