eISSN: 2373-6372


Research Article Volume 14 Issue 2
Department of Medicine, University of Science Arts and Technology, Montserrat, USA
Correspondence: Orien L Tulp, College of Medicine and Graduate Studies, University of Science Arts and Technology, Montserrat, British West Indies, MSR1110, USA , Tel 17272526210
Received: March 19, 2023 | Published: March 31, 2023
Citation: Tulp OL. Effect of the obese phenotype on expression of hepatic T4–5’ deiodinase activity, T3 generation and thyroidal mediated actions in congenic LA/Ntul//–cp rats. Gastroenterol Hepatol Open Access. 2023;14(2):58-62. DOI: 10.15406/ghoa.2023.14.00546
Parameters of thyroidal responses to diet and environment have long been shown to be impaired in the obese phenotype of the LA/Ntul//–cp rat. To characterize the effect of expression of the obese phenotype on activity of maximum T4–5’ deiodinase (T4–DI) activity on adiposity and aspects of metabolism, groups of lean and obese littermates were subjected to measures of resting metabolic rate (RMR, VO2) at thermal neutrality (30°C) after a brief fast, followed by dose response Norepinephrine (NE) stimulation. Hepatic T4–DI activity represents a major source of hormonally active T3 in plasma and is readily delivered to peripheral tissues. At 16 weeks of age animals were sacrificed by cervical dislocation, blood was collected, and liver tissue was dissected for measures of serum levels of T3 and T4, and measures of maximal tissue dithiolthreitol (DTT)–stimulated T4–DI activity determined. The retroperitoneal and dorsal white adipose (WAT) depots were also dissected to estimate the magnitude of adiposity present upon sacrifice in each phenotype. Measures of RMR and the VO2 response to NE were greater in lean than obese phenotype, and indicators of BW and adiposity were much greater in obese than lean (p=<0.01). Measures of serum T3 were greater in lean than obese, but T4 was similar in both phenotypes. Measures of the rate of hepatic T4 DI activity were greater in lean than obese (p=<0.05), and the T1/2 for T4 disappearance were also prolonged in the obese phenotype. These results are consistent with other studies of impaired nonshivering thermogenesis in this strain, and suggest that decreased activity of hepatic T4–5’ deiodinase activity may be a contributing factor in the impaired capacity for nonshivering thermogenesis and excess fat accretion in the obese phenotype of this strain.
Keywords: deiodinase, liver, plasma T3, RMR, weight gain, adiposity
RMR, resting metabolic rate; NE, Norepinephrine; TH, Thyroid hormones; TR, thyroid receptor; TBGs, thyroid hormone binding globulins; T3, triiodothyronine
Thyroid hormones (TH) are known to bring about the expression of numerous energy modulating metabolic actions in peripheral tissues of man and animals, expressed via intracellular mRNA–mediated actions on the genome.1 As such, thyroid hormones contribute essential roles in normal development, growth, and metabolism during early growth, while in adults, the primary effects of THs are manifested by alterations in the rate of substrate metabolism and corresponding oxygen consumption.1-4 These thyroidal actions in adult animals bring about changes in elements of carbohydrate, protein and lipid oxidation and in the efficiency of energy metabolism and expenditure often with only minor alterations in excess weight gain.4 As reviewed by Rifani, weight gain to accomplish viewed by Rifai, to accomplish these actions, intracellular thyroid receptor (TR) proteins normally bind to the thyroid receptor elements (TREs) in the presence or absence of triiodothyronine (T3).1 In the absence of T3, TRE coreceptor elements bind to the TRs to the TR–TRE complex and thereby inhibit or repress the rate of transcription normally activated by T3–bound TREs. T3 serves as the primary activating hormone, some 15–fold more effective than T4 in eliciting a hormonal response. Binding of T3 to the TR on these positive TREs relieves the coreceptor inhibition and permits the THs to bring about the mRNA expression including the protein synthesis that typically follows such actions. The repression of TH gene expression is due to TR corepressors, of which there are several varieties. These proteins bind to the TR when the T3 binding site is vacant, and readily dissociate from the TR when the receptor binds T3.1–4
Thus, cellular generation of the availability of T3 via T4–5’ deiodinase plays a critical role in hormonally activating the prohormone T4 to hormonally active form of T3 via enabling an outer ring 5’ deiodination to form hormonally active T3.2–6 Once present, T3 can then displace the T3 corepressor and occupy the TRE. The peripheral availability of plasma T3 concentrations are also dependent on the activity of deiodinase activity in liver and other tissues to generate free T3, which undergoes plasma transport and distribution predominantly via thyroid hormone binding globulins (TBGs), with only small quantities remaining in the TBG free faction. The thyroidal feed–back regulation of thyroidal T4 and T3 formation is based on the plasma concentrations and likely occurs normally, and thus assures adequacy of T4 availability to undergo hormonal activation in liver and other peripheral tissues. The T4 deiodinase enzymes occur in three isoforms, including two outer ring deiodinases termed D–1, D–2 respectively and one inner ring deiodinase (D–3) that can hormonally inactivate the T4 prohormone by catalyzing the deiodination of the inner ring iodine (I) on the 5 position.5 The D–3 deiodinase becomes more active and the D–1 and D–2 deiodinases less active during energy deprivation, starvation, or other metabolic conditions necessitating conservation of energy expenditure.4–6 Thus the purpose of the present study was to determine the hepatic capacity to deiodinate T4 to the hormonally more active form, T3, and to correlate the plasma T3 concentrations and parameters of energy metabolism to the deiodinase actions. In addition, the activation of the TREs requires formation of a heterodimer configuration complex with 9–cis–retinoic acid receptor (RXR) in order to form the most effective TR configuration for genome transcription.1
The congenic LA/Ntul//–cp rat is deemed to be a suitable animal model to investigate parameters of thyroid hormone actions and obesity in that the known difference between the lean and obese phenotype is the epigenetic expression of the obesity.7–9 The corpulent trait was derived from the Koletsky rat and bred into a LA/N strain at the NIH by Hansen, followed by 12 cycles of backcrossing to attain the congenic status10–12 The obesity in the new strain occurs via an autosomal inheritance of the corpulent (–cp) trait in 25% of the offspring of breeding pairs that are heterozygous for the trait with great reproducibility over many generations of offspring.7,12 Those offspring that are destined to become obese begin to outpace the weight gain of their lean littermates by 4 to 5 weeks of age, in addition to gradually assuming a broader stance presumably in preparation for their obese destiny. By adulthood, the obese phenotype develop hyperinsulinemia, hyperamylinemia, hyperlipidemia and impaired glucose tolerance, but remain euglycemic and non–diabetic.8,13 The LA/N background is noted for its longevity and the lean phenotype typically outlives their obese littermates by one year or more.8,10–13
Groups of lean and obese congenic female LA/N//–cp rats were reared in littermate pairs housed in plexiglass shoebox cages lined with 1 inch of pine shavings from weaning at 22°C and 50% RH on a reverse light cycle (light 2000– 0600hrs.). Measures of plasma T3 and T4 were obtained between 5 and 6weeks of age by tail bleeding and again at 16weeks of age upon sacrifice via cervical dislocation with a small animal guillotine. Measures of resting and norepinephrine–stimulated (100 or 200µg NE/kg BW, s.c.) oxygen consumption (VO2) were obtained in quietly resting animals at 14–15weeks of age in a Collins small animal spirometer apparatus fitted with a 4 liter volume closed–circuit animal chamber as previously outlined7,8 and data expressed as ml O2 consumed per minute per Kg BW -0.75 to account for differenced in body weight and surface area.14,15 The subcutaneous injection site of the NE was in the upper mid dorsal region, adjacent to the location of the Interscapular brown adipose tissue located directly below. At 16weeks of age animals were sacrificed via humane quick cervical dislocation with a small animal guillotine and bloods collected, serum separated via centrifugation (2000rpm x 10minutes) and serum frozen at –20°C for later analysis. The liver was dissected in its entirety for determinations of T4–5’deiodinase activity in the presence of DTT (34mg/dl) to optimize deiodinase activity as reported elsewhere.17–19 Tissue protein content was determined by the phenol method of Folin and Ciocauitau20 and the rate for deiodinase activity was expressed as pmol of T3 generated/mg protein/hour at 37°C and pH 7.40.18 The retroperitoneal and dorsa l adipose tissue depots were likewise dissected and weighed to the nearest mg on an electronic balance. The extrathyroidal plasma half–life of T4 was determined after i.v. infusion of 1µCi of I131 T4 into the posterior tail vein in Lugol’s solution pretreated rats and measures of plasma radioactivity determined in 100µl aliquots of heparinized plasma for 24 hrs. post injection.20 Urine contaminated bedding collections was obtained daily for 7days post infusion to monitor radioactive excrements and were negative after 72hrs. Measures of thyroid hormones were determined by solid phase RIA as reported previously. Data were analyzed via standard statistical procedures.21 the Institutional Animal Care and Use Committee approved the study.
The effect of phenotype on initial and final body weight is depicted in Figure 1 and indicate that body weights of the obese phenotype were already greater than in the lean phenotype at the outset and continued to increase at a greater rate thereafter. The net gain of the obese phenotype was significantly greater than in the lean phenotype, exhibiting a rate of weight gain that was more than 3 times greater than their lean littermates consuming the same diet. (p=<0.001).
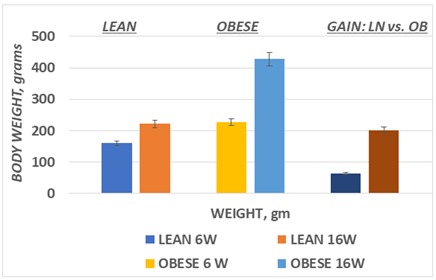
Figure 1 Body weights and 10 week weight gain in lean and obese phenotypes of the LA/Ntul//-cp rat.
Data are mean ±1 SEM, n=12 rats/phenotype. P=< 0.05 at 6 weeks and < 0.001 at 16 weeks of age.
Average weight gain Obese >> lean at p=<0.001.
Measures of liver weights and fat pad mass obtained at 16 weeks of age are depicted in Table 1 and indicate that the fat pad weights of the obese phenotype was significantly greater than occurred in the lean phenotype, measuring more than 5–fold greater in the dorsal subcutaneous depot and more than 20–fold greater in the visceral retroperitoneal depot. In addition, the liver mass of obese rats was also significantly greater than in their lean littermates despite consuming the same diets both during preweaning and postweaning stages of growth. Of interest, the mass of the IBAT was more than 3–fold greater in the obese phenotype, despite the decreased rate of expression of nonshivering thermogenesis, commonly observed in the obese of this strain, and a key thermogenic function of that tissue. The enlarged livers from the obese phenotype were also visually indicative of early stages of fatty infiltration however, when compared to the richness of the deeper brownish coloration observed in livers from their lean littermates. Insulin resistance has been linked to the unbrowning of brown adipose tissue and in all likelihood contributed to the observation in the IBAT dissected from the obese phenotype.22
Phenotype |
n |
Liver |
Retroperitoneal |
Dorsal |
IBAT |
Lean |
12 |
6.06±0.33 |
0.81±0.10 |
0.33±0.04 |
0.27±0.02 |
Obese |
12 |
12.64±0.59 |
15.94±3.30 |
1.67±0.88 |
0.95±0.11 |
Phenotype fold increase |
|
2.1x |
23.4x |
5.1x |
3.5x |
P = |
|
<0.001 |
<0.001 |
<0.001 |
<0.001 |
Table 1 Liver and Fat pad weights of lean and obese rats
The effects of lean and obese phenotype on resting and NE–stimulated oxygen consumption over a broad dose response range are depicted in Figure 2, and indicates that the RMR of the lean phenotype is greater than the obese phenotype. In addition, the NE dose response curve in the Figure indicates that the thermic response to NE resulted in a significant dose related increase in the lean phenotype. In contrast, the thermogenic responses of the obese rats administered similar dosages of NE were of less magnitude that in the lean littermates and failed to demonstrate the same dose related range of responses as occurred in their lean littermates. The dosage was based on the weights of the animals, at 100 or 200 µg per kg of body weight, thus the actual dose the obese animals received was greater than was administered to the lean animals because the obese animals weighed nearly twice as much. Thus, despite the greater absolute quantity of NE administered to the obese, in combination with a substantially greater mass of brown adipose tissue in their interscapular region, and in close proximity to the site of the NE injection, the thermogenic responses were of lesser magnitude than would have been predicted.
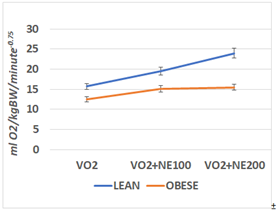
Figure 2 RMR and Norepinephrine stimulated VO2 of lean and obese rats at 14 weeks of age.
Data are mean ±1 SEM, n=6 rats per treatment group. NE administered at 100 or 20µg/kg.
BW, s.c. and the peak NE stimulated response was taken at 15minutes post injection.
P =< 0.05 lean vs obese. NE effect is p =<0.05 for lean rats at both dosages; p=<0.05 for
NE treatment in obese rats, but the 200 dose was without additional significant effect in the Obese phenotype.
Serum T3 concentrations obtained at 6 and again at 16 weeks of age are depicted in Figure 3 and indicate that serum T3 concentration of lean rats were significantly greater than in the obese phenotype at both ages. In addition, the serum T3 concentrations in both phenotypes tended to be modestly greater at 16 than at 6 weeks of age. Serum T4 concentrations are depicted n Figure 4 and indicate that serum T4 concentrations were similar at both ages and in both phenotypes.
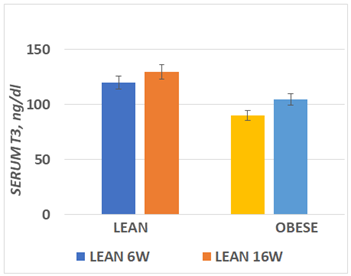
Figure 3 Serum T3 concentrations at 6 and 16 weeks of age.
Data are mean ± 1 SEM, n= 6 rats/group. P= <0.05 for phenotype at both ages.
Serum T4 concentrations are depicted in Figure 4 below, and indicate that the serum concentrations of T4 were similar in both phenotypes and tended to be only modestly lower in the obese phenotype, but that the decrease failed to reach significance (p=<0.10) as occurred in the corresponding measures of T3 depicted above.
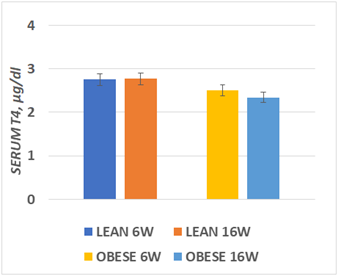
Figure 4 Serum T4 concentrations at 6 and 16 weeks of age.
Data are mean ± 1 SEM, n= 6 rats/group. P= n.s. for phenotype at both ages.
The effects of phenotype on the rate of DTT–stimulated T4–5’ deiodinase activity are depicted in Figure 5 and indicate that the rate of outer ring 5’ deiodination per mg of protein was greater in the lean than the obese phenotype, consistent with the lower serum T3 concentrations observed above. One implication of this finding is that the rate of hormonal activation of T4 was decreased in the obese phenotype, consistent with the observation of a decreased expression of thyroidal–mediated parameters of metabolism including RMR and NE–stimulated thermogenic responses noted above in the lean phenotype.
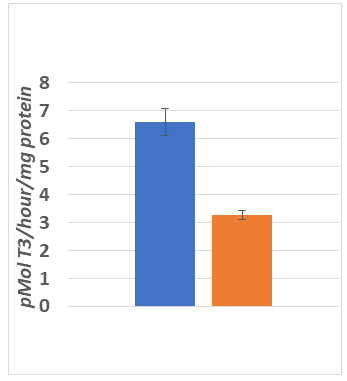
Figure 5 Thyroxine 5’deiodinase activity in lean and obese rats.
Data are mean ±1 SEM, n=6 rats per group; p =< 0.01 (Students unpaired t test)
Measures of tissue T3 and tissue protein concentration in the homogenates is depicted in Figure 6 below, and indicates that tissue T3 concentrations depicted in the left side of the Figure were greater in the lean than the obese phenotype, when measured in tissue homogenates obtained from liver tissues at 16 weeks of age. In contrast, and as reflected in the right section of the Figure, the tissue protein concentrations were similar in both phenotypes, consistent with the lower rate of deiodinase activity in Figure 5 above.
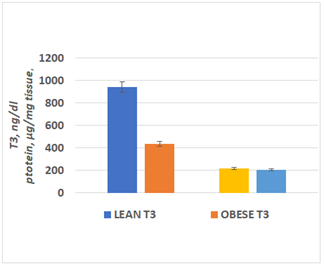
Figure 6 Measures of tissue T3 and protein concentrations in lean and obese rats.
Data are the mean ± 1 SEM, n=6 rats per treatment group. P=<0.05 for T3, p=> 0.10 for protein (n.s.)
Measures of the rate of 131I–T4 disappearance are depicted in Figure 7 below, and indicate that the half–life of extrathyroidal disappearance of T4 is significantly prolonged in the obese phenotype, nearly twice as long as occurred in their lean littermates. The prolonged half–life occurred despite similar housing, environmental and nutritional diet throughout their lifespan.
The purpose of the present study was to investigate the activity of hepatic T4–5’ deiodinase activity in the obese phenotype of the LA/Ntul//–cp rat rat, following multiple reports of decreases in circulating T3 and impaired thermic responses to diet and environment.6-8,20 The liver represents a major extrathyroidal organ for the peripheral generation of plasma T3 via conversion of thyroidally generated T4 to the more hormonally active form, T3 via an outer ring 5’ stereo–specific deiodination.2-4,18 The deiodination occurs via the combined actions of two isoforms of the deiodinase, D–1 and D–2, both of which target the 5’ position of T4 via a combination of constitutional and adaptive actions. The genomic or environmental conditions that may favor one isoform over the other remain unclear. The net peripheral generation of T3 occurs however following dietary and environmental changes which are indicative of increasing or decreasing the rate of metabolism in peripheral tissues, in addition to employing facets of intermediary metabolism to further modulate peripheral heat generation as the immediate or longer term needs of the animal may be indicated. The origins of the impaired elements of peripheral metabolism likely also include a hypothalamic component, as in earlier studies the hypothalamic implantation of hypothalamic tissues from homozygous animals resulted in an amelioration of the continued progression of obesity and some accompanying endocrinologically–mediated parameters in the obese phenotype of the Zucker rat strain, where the genomic location of the fundamental defect resulting in the obese phenotype is similar.23 The role of potential glucocorticoid–insulin interactions on T3–mediated steps in intermediary metabolism, or an impairment of expression for deiodinase biosynthesis or actions remains unclear, but remains an area of investigation as the obese phenotype of this and other obese rodent strains invariably present with hyperinsulinemia and insulin resistance from an early age, in addition to dysregulation of glucocorticoid actions.24,25 Indeed, perturbations in protein synthesis and degradation are commonly observed among the various effects noted to become compromised in states of hyperinsulinemia and insulin resistance in peripheral tissues and have been shown to become dysregulated in the obese phenotype of this and other strains.8,25–28
The results of this study indicate therefor that the hepatic conversion of the prohormone T4 to the hormonally active from T3 is decreased in the obese phenotype of this strain and supports the speculation that modulation of peripheral thyroid hormone actions may contribute to the expression of the ‘thrifty gene’ and to the health and wellbeing during extremes of nutritional survival.29 Decreased availability of plasma T3 is associated with decreased parameters of metabolic actions commonly associated with thyroidal–mediated actions. Thus, the liver functions in effect as a quasi–endocrine organ via releasing a hormonally active form of thyroid hormone that may be readily transported to other tissues and organs, in addition to balancing it’s metabolic requirements against the inactivating process via Type 3 inner ring deiodinase, resulting in a hormonally inactive metabolite of T3 or T4 commonly referred to as ‘reverse T’3 or simply ‘rT3’. The biochemical basis for the decreased 5’deiodinase activity in the obese phenotype remains unclear, as the results obtained could likely have occurred due to a decreased genomic expression of the enzyme, an incompletely functional enzyme, or via phenotype associated decreases in substrate or cofactor availability at the enzymatic site. Virtually all peripheral tissues are known to require availability of hormonally active T3 for modulation of metabolic activity, and many if not all likely possess an innate capacity to generate T3 from T4 internally, thus decreasing their complete dependence of hepatic or thyroidally generated T3 as a sole source of the hormone. The liver however remains codominant in the process of peripheral generation of T3 however, due to its vigorous blood flow throughout the day, its ability to modulate plasma substrate concentrations, in addition to its non–reliance on insulin mediated substrate transport for glucose and uptake of other metabolites as occurs in skeletal muscle, adipose, and other tissues. In that sense, the intracellular expression of GLUT transporters originating in the endoplasmic reticulum becomes decreased in the presence of increased glucocorticoid activity, subsequently impeding glucose uptake in insulin–dependent peripheral tissues, and ultimately progressing to hyperinsulinemia and insulin resistance and their pathophysiologic sequela including enhanced metabolic and caloric efficiency and excess fat accretion.
The results of this study confirm the activity of hepatic T4–5’ deiodinase activity, both on a per unit of liver mass and the overall net activity of the liver to be decreased in the obese phenotype of the LA/Ntul//–cp rat strain, a congenic animal model where the only known epigenetic difference between the lean and the obese phenotype is the presence of the autosomal recessive corpulent or –cp trait. Thus, this finding is deemed to have a high degree of relevance and likely occurs in other obese rodent models especially where the genomic linkage for the obese trait and its expression is similar. It remains unclear, however if the same phenomena may occur in humans or other vertebrate species, but the fundamental role of hepatic deiodinase activity in the metabolic activation of thyroid hormones to their active form and the subsequent metabolic actions downstream from the peripheral generation of the hormonally active T3 hormone remains an active and unresolved area of the metabolic and biochemical processes that contribute to the development of caloric efficiency, excess adiposity and culminating in obesity in man and animals.
The author expresses thanks for the many participants in the data generation for this paper including Dr Steve Dubin, DVM, Ms. Deborah Outtrim, MS and Mr. Huang Peisong, MS who assisted in various aspects of this research.
We declare there are no conflicts of interest.
None.

©2023 Tulp. This is an open access article distributed under the terms of the, which permits unrestricted use, distribution, and build upon your work non-commercially.