eISSN: 2373-6372


Research Article Volume 5 Issue 4
1Department of Medical and Pediatric Sciences, University of Catania, Italy
2Department of Medical-Surgical specialties, University of Catania, Italy
3Department of Legal Medicine and Toxicology, University of Catania, Italy
Correspondence: Leonardo Samperi, Department of Medical and Pediatric Sciences, University of Catania, Ospedale Morgagni Pierantoni, Via C. Forlanini 34, Forl, Tel 543735044, Fax 543735689
Received: August 21, 2016 | Published: November 4, 2016
Citation: Samperi L, Foti P, Puzzo L, Ognibene N, Inserra G (2016) Diagnostic Performances of Diffusion-Weighted Magnetic Resonance Imaging in the Evaluation of Fibrosis and Post-Operative Endoscopic Recurrence in Crohn’s Disease. Gastroenterol Hepatol Open Access 5(4): 00151. DOI: 10.15406/ghoa.2016.05.00151
Background: Diffusion-weighted represents a new application of magnetic resonance imaging (DW-MRI) to assess inflammatory activity in Crohn’s disease. ADC is a quantitative parameter of this phenomenon. We aimed to verify the correlation between DWI findings both with pathological evaluation of fibrosis in surgical specimen both with endoscopic recurrence.
Methods: 31 pts undergoing ileocolonic resection for CD were submitted to DW-MRI. Conventional MRI findings of terminal or neo-terminal ileum were recorded together with a semiquantitative evaluation of DWI signal intensity and with ADC calculation. For the first aim, Acute Inflammatory (AIS) and Fibrostenosis score was correlated to ADC values of matched ileo-cecal segment. ROC curves analysis was used to find out an ADC cut-off value able to distinguish "low and high grade" severity of post-operative recurrence.
Results: Comparison of DWI findings with surgical specimens pathologic evaluation showed a very good correlation, inverse and statistically significant, between ADC and AIS total (r=- 0.90, p=0.013). The mean ADC value of the 5 pts with fibrosis was not statistically different from the 5 pts without. The comparison between ADC and Rutgeerts’score showed a good correlation, inverse and statistically significant (rho= -0.73, P=0.002). ROC curves analysis highlighted that a value of ADC ≤82 x10-3 mm2 /s could predict a severe recurrence (Rs >i2) with a sensitivity of 88.9% and a specificity of 83.3%.
Conclusion: This study showed the ability of DWI sequences to provide quantitative measures of inflammation, allowing a more objective assessment of CD. Further studies should clarify whether ADC evaluation could predict the presence of fibrosis in surgical specimens.
Keywords: crohn's disease, apparent diffusion coefficient, diffusion weighted magnetic resonance imaging, magnetic resonance enterocolonography, acute inflammatory score, rutgeerts’score, fibrostenosis
CD, crohn's disease; ADC, apparent diffusion coefficient; DW-MRI, diffusion weighted magnetic resonance imaging; MREC, magnetic resonance entero-colonography; AIS, acute inflammatory score; RS, rutgeerts’score
In the last decade magnetic resonance imaging (MRI) has been increasingly used for the study of chronic inflammatory bowel diseases. MRI has some advantages compared to the traditional imaging techniques: excellent contrast reso-lution, non-invasiveness, cross-sectional imaging, possibility to obtain luminal, parietal and extra-intestinal findings, absence of radiation exposure.
Moreover MRI can provide functional information about intestinal wall (motility) that cannot be obtained with other imaging techniques such as computed tomography (CT).1 All these factors make MRI particularly suitable for diagnosis and follow-up of patients with Crohn's disease, who are often young and will have to undergo repeated assessments. Diffusion weighted imaging (DWI) represents a new perspective of MR applied to the study of abdominal pathologies, is based on the diffusion motion of water molecules 2 and displays information about extracellular compartment, tissue cellularity and the integrity of the cellular membranes.3 This technique has been applied in oncological setting, in the detection and characterization of cerebral, thoracic, abdominal neoplastic lesions and in the evaluation of tumoral response to chemioterapic treatments4-7 Other applications are represented by the study of inflammatory diseases of the brain, kidney, liver.8-10 Only in the last years DWI sequences have been applied to the study of chronic inflammatory bow-el diseases.11-13
Diffusion weighted images are characterized by high contrast resolution that allow to distinguish disease-active intestinal segments from normal bowel loops;14 moreover these sequences allow quantitative measurements such as apparent diffusion coefficient (ADC) that can be used to quantify water diffusion in vivo. The basic principle of our study, leading us to examine the usefulness of DWI sequences with ADC calculation in Crohn's disease, is that the presence of the characteristic elements of inflammation implies an increase in interstitial cellularity resulting from the expansion of lymphatic canaliculi. The increase of cell density, viscosity and the development of granulomas can reduce extracellular space and contribute to restriction of water molecules’ diffusion within inflamed bowel wall.
The ability to proceed to quantify the restriction of diffusion should return, in an inverse proportionally way, the transmural bowel wall damage of Crohn’s disease.
The purposes of our study were:
This observational prospective study was conducted in accordance with recommendations of the lo-cal ethics committee and to the declaration of Helsinki, includes patients aged >18 years with histological diagnosis of Crohn’s disease (CD) undergoing ileocolonic resection for complications, with MR-DWI performed within 2 months before surgery or post-surgical follow up ileocolonoscopy.
According to these criteria 31 patients were included in the study as follows:
0 - None |
|
Mucosal Ulcerations |
1 - Aphtous ulcers (< 7 mm) |
2 – Linear ulcer |
|
3 – Confluent large ulcer |
|
Edema |
0 - None |
1 - Mild |
|
2 - Moderate |
|
3 - Severe |
|
Neutrophils |
0 - No increase |
1 - Mild increase |
|
2 - Moderate increase |
|
3 - Marked increase |
|
Depth of neutrofilic penetration |
0 - None |
1 - Mucosa |
|
2 - Submucosa |
|
3 - Muscolaris |
|
4 - Serosa and/or extramural fat |
Figure 1 Acute Inflammation Score (AIS) Borley NR et al.15
Grado 0 (none) |
Absence of fibrosis or minimal fibrosis limited to the mucosa (<25%) |
Grado 1 (mild to moderate) |
Mild stricture with nondilatated lumen with submucosal fibrosis (>25%) and/or muscolar hyperplasia with preserved layers |
Grado 2 (severe) |
Massive transmural fibrosis and/or effacement of normal layers and/or severe stricture |
Figure 2 Fibrostenosis Score Chiorean MV et al.16
Sex 6 |
M, 4 F |
Age at inclusion (years), mean ± SD |
46 ± 10.2 |
Disease duration (years) median |
8.3 ± 6.3 |
Resected ileum (cm), mean ± SD |
17.8 ± 9.3 |
Resected right-colon (cm), mean ± SD |
8.7 ± 7.2 |
Patient with mild/moderate fibrosis (n) |
4 |
Patient with severe fibrosis (n) |
1 |
Table 1 Baseline population characteristics of patients undergone to elective ileo-colonic resection
Sex |
11F, 10M |
Age at diagnosis (years), mean ± SD |
29.3 ± 7 |
Age at inclusion (years), mean ± SD |
43.4 ± 8 |
Disease duration (years) median |
4.3 ± 6.6 |
Endoscopic follow-up after surgery (months), median [IQR] |
15 [6-32] |
Active smokers, n (%) |
-38 |
Anoperineal lesion, n (%) |
-14 |
Location, n (%) |
|
L1 |
2 (14) |
L2 |
0 |
L3 |
18 (86) |
L4 |
1 (5) |
Pattern disease n (%) |
|
B1 |
5 (24) |
B2 |
10 (48) |
B3 |
6 (28) |
Family IBD history, n (%) |
10 (48) |
Extraintestinal manifestations n (%) |
9 (43) |
Surgical procedure at onset disease n (%) |
10 (48) |
Systemic steroid therapy at onset disease n (%) |
9 (43) |
Steroid-dependence n (%) |
13 (62) |
Steroid-resistance n (%) |
4 (19) |
Table 2 Baseline population characteristics of patients in post surgical follow-up
Conventional MRI findings of terminal or neoterminal ileum were recorded together with a semi-quantitative evaluation of DWI signal intensity using a 3-point scale. To obtain ADC, images were magnified and a ROI was placed on neo-terminal ileum. In patients in post-surgical follow-up were noted also pattern disease according to Montreal classification, smoking status, family history of IBD, disease’s chronicity, systemic steroid therapy or any surgical procedure on the onset, steroid-dependence/resistance and extraintestinal manifestations.
Histopathological analysis of the surgical specimens
Each surgical specimen was opened in the middle, between the mesenteric and the antimesenteric side, and fixed in 10% formalin for 24 hours. After washing in cold water, the pathologist (L.P. dedicated to histopathological evaluation of the gastrointestinal tract) obtained histological slices on the site of the most representative sample for analysis.
Each block was fixed in 4% formalin, and then in paraffin for slicing. The slices were then stained with hematoxylin-eosin assay, examined by light microscopy at increasing magnifications of x20, x40 and x100hpf and were graded according to criteria proposed by scores of Borley et al.15 & Chiorean et al.16
MRI imaging protocol
MR imaging was performed with a closed-configuration superconducting 1.5-T system (Signa HDxT; GE Healthcare, Milwaukee, Wis) with 57.2mT/m gradient strength and 120T/m/s slew rate, by using an eight-channel high-resolution torso coil with array spatial sensitivity technique (ASSET) parallel acquisition.
Preparation: Patients fasted for 6 hours before the MRI examination. Bowel distension was obtained trough oral administration of a biphasic contrast agent, a polyethylene glycol solution (PEG 4000) (Selg-esse 1000, Promefarm, Italia); a total of 1000 ml was administered orally to all patients over the course of 45 min before scanning.17 The included patients did not receive any bowel cleansing or rectal preparation before.
After intravenous administration of 20 mg N-butil-scopolamine (buscopan), the following sequenc-es were acquired:
Patients were placed in the supine (more comfortable) (feet-first) position in the MR imager. All sequences were acquired in breath-hold modality. For axial sequences, the upper abdomen and pelvis were scanned separately. Total scan time was about 40 minutes.
Image analysis
A first analysis concerned with the identification of conventional MRI findings in the terminal ileum: mural hyper-enhancement and wall thickening, increased T2 signal, mural stratification, adjacent enlarged lymph nodes, penetrating disease, dilatation. In the visual assessment, the signal intensity of the terminal ileum wall on DWI (b-value = 800 mm2/s) was graded on a three-point scale as 0, 1, or 2 for intensity as low as, slightly higher than, or definitely higher than the adjacent normal-appearing loops, respectively. Segments graded as 1 or 2 were considered to have active disease.
In patients who had previous ileocolectomy and ileo-cecal anastomosis, the small bowel segment anastomosed to the colon (neo-terminal ileum) was regarded as ‘‘terminal ileum.’’ ADC value measurements from the wall of the terminal ileum were performed on a workstation with diffusion analysis software (Advantage Windows version 4.6, software fun tool, General Electric Medical Systems, Milwaukee, WI, USA,). To obtain the ADC measurements, the images were magnified and an oval ROI, variable area between 12 and 30 mm², was placed on the bowel wall. The measurements were carried out on the area of brightest signal intensity on the DWI images.
Endoscopic evaluations
In post-surgical follow-up, the Rutgeerts’ score evaluation as standard of reference, was given by a single endoscopist with endoscopic experience in IBD. In particular, to make easier the correlation with qualitative data of DW-MRI (grading 0,1,2), it was decided to divide the patients according to two criteria. The first one included 3 classes depending on the degree of endoscopic recurrence, as follows: Rutgeerts’ score i0 - i1 (absent or mild recur-rence, grade 0), Rutgeerts’ score i2 - i3 (moderate recurrence, grade 1), Rutgeerts’ score i4 (severe recurrence, grade 2). In the second criteria, the division was implemented simply into two classes (low and high grade of recurrence) when, respectively, Rutgeerts’ score ≤i2 and Rutgeerts' score >i2 (Rs ≤ 2 and Rs > 2), in order to seek a cut-off value of ADC that would allow the distinction between two degrees of recurrence.
MRI qualitative (DWI hyper-intensity grading) and quantitative (ADC) findings were compared with these standard.
Statistical analysis
Statistical analysis was performed using the SPSS software. Quantitative measurements (ADC) were expressed as mean±standard deviation. The correlation with endoscopic recurrence was studied by Spearman's rho. ROC curves analysis was used to find out an ADC cut-off value able to distinguish “low and high grade” severity of post-operative recurrence. Moreover, ADC values of patients with “low grade endoscopic recurrence” (Rutgeerts’ score ≤i2) were compared with those “high grade endoscopic recurrence” (Rutgeerts’score >i2) using Mann-Whitney U test. In patients subjected to elective surgery for enteric complications, Acute Inflammatory score (AIS) and Fibrostenosis Score was correlated, respectively, by Spearman's rho and Pearson’s r to ADC values of matched ileocecal segment Figures 4 & 5.
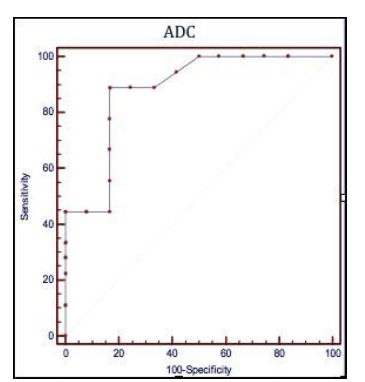
Figure 3 Receiver operating characteristic (ROC) curves illustrating the performances of the apparent diffusion coefficient (ADC), the quantitative parameter of Diffusion-Weighted Magnetic Resonance to predict a post operative recurrence Rutgeerts’ score > i2
ADC ≤ 1,82 x 10⁻³ mm2/s
Sensibilità 88,9% (51,8 – 99,7; CI 95%)
Specificità 83,3% (35,9 – 99,6; CI 95%)
Rutgeerts’score > i2
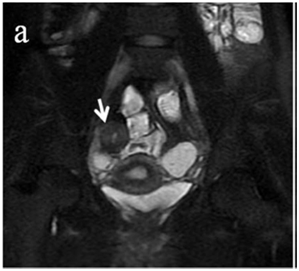
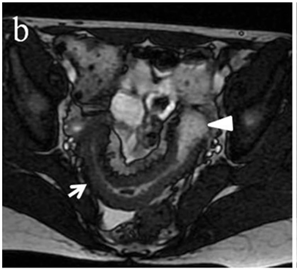
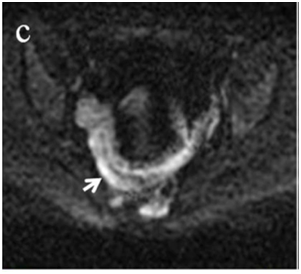
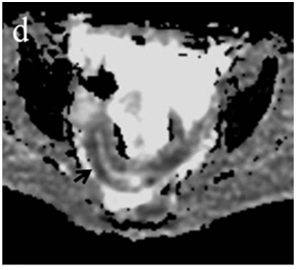
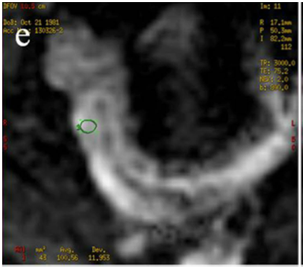
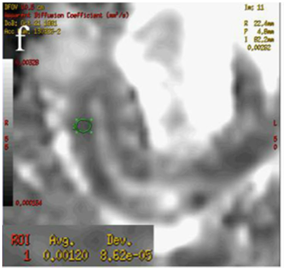
Figure 4 (a) Coronal SSFSE (singleshot fast spin echo) T2-weighted image with fat suppression (b) axial FIESTA (fast imaging employing steady-state acquisition) image show wall thickening (white arrow) and stenosis of the lumen in the terminal ileum. Note the prestenotic dilatation in b (white arrowhead). (c) Neoterminal ileum wall is thickened and has high signal on diffusion-weighted (DW) image (b= 800 s/mm2) (white arrow) and dark signal (black arrow) on the apparent diffusion coefficient (ADC) map in (d) indicating restricted diffusion. (e,f) ADC value measurement from the wall of the terminal ileum on magnified DW image. (e) and corresponding ADC map (f): ADC value = 1.20 × 10⁻³ mm2/s
Comparison of DWI sequences with hystopathology
Inflammatory evaluation: In all patients the DWI sequences have provided images of sufficient quality for the measurement of the ADC. Comparison of DWI findings with surgical specimens pathologic evaluation showed a very good correlation, inverse and statistically significant, between ADC and acute inflammatory score (AIS) (rho=-0.90, p=0.013).
The correlation between ADC and 4 parameters that make up the AIS ranges from good to moder-ate but was not statistically significant Table 3.
ADC |
AIS |
Ulcers |
Edema |
Neutroph |
Depth n.p. |
-0,90ᵃ |
-0,79 |
-0,09 |
-0,79 |
-0,57 |
Table 3 Spearman’s rho ª P <0,05
Fibrostenosis evaluation: The mean ADC value of the 5 patients who underwent surgery with fibrosis (4 mild moderate, 1 severe) resulted (1±0.19) x 10-3 mm²/s, statistically no different than the other 5 patients without fibrosis (1.4±0.48) x 10-3 mm²/s underwent resection for other enteric complications or contraindications to medical therapy (P = 0.26) (Table 4).
|
Histological examination |
ADC mm²/s |
t Test |
|
Fibrosis (mild-moderate) |
(1 ± 0,19) x 10-3 |
P= 0,26 |
|
No Fibrosis |
(1,4 ± 0,48) x 10-3 |
Table 4 Histological examination
There was an inverse correlation between ADC value and the presence of fibrosis, but not statistically significant (Pearson’s r = - 0.55, P> 0.05) (Table 5).
Pearson’s r |
P (α =0 ,05) |
|
ADC – fibrosis |
- 0,55 |
n.s. |
Table 5 Pearsons
Post-surgical recurrence evaluation
Qualitative analysis: In all patients the DWI sequences have provided images of sufficient quality for visual evaluation. Based on visual assessment of DWI sequences, the evaluation of post-operative recurrence as mild (i0-i1), moderate (i2-i3) and severe (i4), performed at level of the stoma and neo-terminal ileum, was evaluated as grading DWI=0 in 3 patient, such as grading DWI=1 in 8 patients and as grading DWI= 2 in 10. The de-tailed distribution of patients according DWI grading and Rs evaluation is shown in Tables 6-8.
(n°pts) |
Rs (≤2) |
Rs (<2) |
DWI 0 |
3 |
0 |
DWI 1 |
5 |
3 |
DWI 2 |
1 |
9 |
Table 6 DWI qualitative evaluation
(n°pts) |
Rs (i0-1) |
Rs (i2-3) |
Rs (i4) |
DWI 0 |
2 |
1 |
0 |
DWI 1 |
3 |
3 |
2 |
DWI 2 |
1 |
7 |
2 |
Table 7 DWI qualitative evaluation of POR: mild (i0-i1), mode-rate (i2-i3) or severe (i4)
Rs (i0) |
Rs (i1) |
Rs(i2) |
Rs (i3) |
Rs (i4) |
|
DWI 0 |
2 |
0 |
1 |
0 |
0 |
DWI 1 |
2 |
1 |
1 |
2 |
2 |
DWI 2 |
0 |
1 |
1 |
6 |
2 |
Table 8 DWI qualitative evaluation of POR: mild (i0-i1), mode-rate (i2-i3) or severe (i4)
In particular the semiquantitative evaluation of sequences highlighted a VPP=0.67 VPN=0.78 for a grading DWI=0 while grading DWI=1 did not give satisfactory results with sufficient diagnostic accuracy, a DWI=2 grading have a high VPN=0.82 (Table 9).
Sensitivity % |
Specificity % |
Accuracy % |
|
DWI 0 |
33 |
93 |
76 |
DWI 1 |
27 |
62 |
46 |
DWI 2 |
50 |
53 |
52 |
Table 9 DWI qualitative evaluation of POR: mild (i0-i1), mode-rate (i2-i3) or severe (i4)
The correlation analysis by calculating the Spearman's rho, between DWI grading and Rutgeerts'score (rating standard) was found to be excellent and statistically significant (Spearman's rho = 0.90 with P <0.001). It was also analyzed the correlation between DWI and Rutgeerts'score (classified according to three degrees of relapse in mild, moderate and severe), which was good and highly significant (Spearman's rho = 0.74, P <0.01), reaching maximum correlation with the division into two degrees of recurrences “low grade Vs high grade” (Spearman's rho = 0.98 P< 0,01) (Table 10).
Rutgeerts’ score - DWI - Spearman’s correlation |
P |
||
2≤RS > 2 |
RS 3G |
RS 5G |
p<0,01 |
0,98 |
0,74 |
0,90 |
|
Table 10 Rutgeerts’ score - DWI - Spearman’s correlation
Quantitative analysis: In all patients the DWI sequences have provided images of sufficient quality for the measurement of the ADC. In particular, the mean ADC for Rutgeerts’score ≤i2 (2.82±0.83) x 10-3 mm² /s was significantly different than mean ADC value for Rutgeerts’score >i2 (1.55±0, 18) x 10-3 mm² /s matching data with Wilcoxon-Mann Whitney U test (P <0.01) (Table 11).
ADC (R’s ≤ i2 |
(2,82 ± 0,83) x 10 ˉ³ mm²/s |
P < 0,01 |
ADC (R’s > i2) |
(1,55 ± 0,18) x 10 ˉ³ mm²/s |
|
Table 11 Mann-Withney U test
The study of correlation between ADC and Rutgeerts' score with standard assessment (i0-i4) showed a good correlation, inverse and statistically significant (Spearman's rho = - 0.73, P = 0.002), as well as between ADC and the other criteria of Rutgeerts’score classification (Table 12).
2≤Rs > 2 |
RS 3G |
RS 5G |
ª p < 0,01 |
-0,85 ª |
-0,53 b |
-0,73 b |
bp < 0,05 |
Table 12 Rutgeerts’ score - ADC - Spearman’s correlation rho
The search for an ADC value to be used as cut-off for the presence of post-operative recurrence of degree i3 or i4 was conducted through the analysis of ROC curves, highlighting that a value of ADC ≤ 1.82 x 10⁻³ mm²/s could predict recurrence of degree >i2 with a sensitivity of 88.9% (51.8 to 99.7, CI 95%) and a speci-ficity of 83.3% (35.9 to 99.6, CI 95%), (Figure 3).
Unfortunately, the small sample size did not allow to calculate whether patients with Rutgeert's score of grade> i2 was more frequently smokers, steroids-dependent or resistant, had more frequent extra-intestinal manifestations, were more frequently subjected to steroid therapy or surgery to the diagnosis than in patients with R utgeerts’ score ≤i2 (Table 13).
Sex |
0.62 |
Smoking habits |
0.61 |
Previous surgery |
0.31 |
Sistemic CS_ diagn |
0.31 |
Site_disease (L1 Vs-L3) |
1 |
Pattern B2 Vs B3 |
0.46 |
EIMs |
0.82 |
Table 13 Fischer’s Test association for Rs >2
In Crohn's disease patients the most important clinical problems are the assessment of the extent and severity of the disease, the distinction between active inflammation and fibrosis and monitoring the response to treatment. This implies the need for repeated evaluations with the minimum load for the patient, which, already burdened by a pathology very often disabling, may decrease its compliance to follow-up. Numerous clinical indices, laboratory and instrumentals were used in the assessment of these aspects, but does not yet exist a standard of reference capable to meet all the requirements without being invasive.
In recent years, MRI has proven to be a reliable method in the diagnosis and follow-up of Crohn's disease, both in pediatric patients that adults and several data about imaging in MR have been pro-posed as "imaging biomarkers" of Crohn's disease activity.18,25 It is known that some of these imaging features were already validated and correlated with histological examination of surgical specimens. Not surprisingly, the results in MRE, because of the inflammatory infiltrate, the increased capillary permeability and edema, are mainly based on the characteristics of thickness wall, T2-weighted and T1 dynamic post-gadolinium sequences.26 Nevertheless, the derivatives of gadolinium, used as contrast agents, can cause nephrogenic systemic fibrosis. In addition, a chronic inflammatory process involves a certain degree of fibrosis and sclerosis of the parietal penetrating arterioles, which could affect the contrast enhancement27 For these reasons and to be less invasive, in the search for new techniques of imaging, DW-MRI sequences appear to be a promising tool in the light of the excellent results obtained in this and other previous studies.
In our prospective observational study, the use of contrast medium has also been adopted and the DWI acquisition after administration of gadolinium may be controversial. Gulani et al.28 have shown that contrast agents, such as gadoversetamide may have an influence on data in DWI of abdominal parenchyma, but the bowel was not rated separately. However, since in our study the DWI sequences were performed approximately 10 minutes after intravenous administration of gadoterato and other studies have shown that gadobutrol has no influence on DWI images of the liver, we can say with good certainty that signal parietal intestinal had already been restored and has not been influenced.
In our study, we adopted some technical. The use of a DWI sequence with parallel imaging (AS-SET factor 2) has reduced susceptibility artifacts, chemical shift and motion. The acquisition of sequences in apnea and the administration of an anti-peristaltic agent (N-butyl scopolamine) during the investigation contributed to further reduce motion artifacts. The choice of a high value of b (800 s/mm²) has minimized the effect of perfusion in DWI images.12,14,21
Several studies have demonstrated that addition of DWI sequences to MRE may increase from 62% to 83% the diagnostic sensitivity of mucosal lesions highlighted endoscopy, by at least 10% the diagnostic accuracy of MRI in the identification of IBD organic lesions or gastrointestinal malignancies, demonstrating an accuracy of 92% in the evaluation of disease activity compared with Double Balloon Enteroscopy (r=0.717, p<0.01 ).29-31
Several studies, all retrospective, with known or suspected Crohn's disease,11-14 have deter-mined the role of diffusion-weighted sequences and ADC values in identifying intestinal inflammation. These have shown that DWI sequences can distinguish intestinal segments with active inflammation by normal loops and that ADC value of segments with active disease was significantly lower than healthy ileal loops. The sensitivity and specificity of DWI sequences in small bowel were between 86% and 94% and between 82% and 97%, respectively, with high predictive positive values.
Recently, some authors have formulated quantitative indices of disease activity based on conventional MRI parameters (Maria score)32 and Clermont score (Maria-DWI score). Buisson & Hordonneau33,34 have found a strong correlation between the two indices in patients with colonic involvement and, although to a lesser degree, of the distal ileum; furthermore has been found good correlation with Clermont score but these quantitative measures are still in process of validation, being understood that these study are limited because didn't use endoscopic findings as reference.
Successively, the same authors demonstrated that DWI MREC, performed within 4 weeks form en-doscopic evaluation, is highly effective to detect endoscopic ulcerations in ileocolonic CD with a mean ADC value inversely correlated with CDEIS (rho=-0.40; p=0.0067) and SES-CD (rho=-0.33; p=0.032) and useful to predict efficacy of anti-TNF induction therapy in CD.35,36
Fibrostenosis and AIS correlation
Our study is the only to compare the DWI sequences, as well as to endoscopic control also that of surgical specimens resected patients, proving, despite a limited sample, there is a strong inverse correlation between ADC value and parietal acute inflammatory score (AIS) of the matched pathological control.
This correlation is significant for total AIS, while ranging from good to moderate for 3 of the 4 parameters that compose the AIS, namely ulcers, the increase and the depth of neutrophilic infiltrate. The edema instead may not be related to the intrinsic mechanism underlying the role of the restriction of diffusion. The matched resected segments were used even to examine the correlation with fibrosis.
It is difficult to predict which patients will develop a fibrostenosing phenotype and how quickly will progress, moreover there are no specific therapies to prevent or treat intestinal fibrosis. It is therefore essential to identify the markers of intestinal fibrosis to stratify patients into specific risk categories, determine the early stages of fibrosis before the development of clinical symptoms, in order to draw a hypothetical line of development which includes the possible responsiveness to anti-inflammatory therapies or anti-fibrotic.
To date, there are no markers of fibrosis that can be used in daily clinical practice and part of the purpose of our study is to evaluate the existence of a possible correlation between ADC and fibro-sis.
As regards the evaluation of DWI sequences, there is a difference between the average value of ADC of patients without intestinal fibrosis (1.4±0.48) x 10ˉ ³ mm²/s and those with mild-moderate fibrosis (1±0,19) x 10ˉ ³ mm²/s, but this difference was not statistically significant. Importantly, the reduced sample size, the fact that 4 patients had a mild to moderate fibrostenosis and that only one had severe, partly accounts this lack of significance and the presence of a moderate inverse correlation between ADC and fibrosis (Pearson's r = - 0.55, P >0.05).
These data, however, are not far from those obtained with other imaging modalities in the evaluation of intestinal stenosis. In experienced hands bowel ultrasonography (US) is an accurate technique for the detection of small bowel stenosis, especially high grade stenosis that may be candidates for surgery. Based on the pooled data of three studies using surgery as reference standard, the sensitivity of US was 79% and specificity was 92%.37
The use of oral contrast media can improve the accuracy of the US in determining the presence and number of stenosis (sensitivity increases from 74% to 89%), but is generally not necessary in patients with symptomatic obstruction.38
The perfusion of the bowel wall involved in the CD may effectively be studied with CEUS. The dynamic assessment of parietal enhancement can be studied with high temporal resolution and has been shown to correlate with the inflammatory activity of bowel wall in some studies,39 although not in others.40 In a recent study,41 the CEUS, used for the evaluation of inflammation in 25 CD patients, using the histology of surgical specimens as standard of reference, showed a good and significant negative correlation between the degree of color doppler enhancement and the pathological score of fibrostenosis. In particular, the degree of correlation is not significantly different from that obtained in our study in the qualitative visual assessment (Spearman's r = 0.50 CEUS Vs r = 0.45 for DWI).
The direct comparison between CT and MRI for the diagnosis of stenosis, in a study of 44 patients, showed sensitivity values comparable between the two methods (85% vs. 92%) with a specificity of 100% vs. 90%.42 The results of seven studies, using as reference standard endoscopy or surgery, have shown that the sensitivity of MRI for the diagnosis of stenosis was 89% and specificity of 94%.37
A better distension is given by MR enteroclysis compared to MR enterography, resulting in a higher sensitivity (100% vs 86%, respectively) and specificity (100% vs 93%) for the determination of ste-nosis, although the difference was not statistically significant.43
Post-surgical recurrence’s evaluation
The direct visualization of mucosal inflammation, then endoscopic follow-up, currently remains the gold standard for measuring the effectiveness of treatments and therefore also for the presence of post-operative recurrence. However, endoscopy is an invasive tool, and patients are poorly complaint to this method, especially in a period of relative well-being that characterize the early stages after surgery. In addition, this examination is limited to the colon and terminal ileum and is often hampered by the presence of stenotic segments of the intestine, including anastomosis, which cannot be reached by the scope. For these reasons, our study also focused on the predictivity by DW-MRI in the evaluation of Rut-geerts’ score.
In this study, even in a small sample of patients meeting the inclusion criteria, has been demonstrated a good predictive value on the recurrence of mild, moderate or severe grade by DWI sequences. The best results have occurred with the grading DWI=0 (VPN=0.78) and DWI=2; (VPN=0.82) although they were accompanied by a suboptimal diagnostic accuracy. These values can be justified by the non-optimal distribution of patients according to three degree of recurrence, but are consistent with results of another study where the lack of hyperintensity on DWI would be able to predict the preservation of the MH in patients in remission for the next two years after anti TNF therapy (data compared with endoscopy) VPN 97%.44 In our study, 6 patients had Rutgeerts’ score mild, 11 moderate and 4 severe.
Despite this distribution, the correlation with DWI grading have proved good and significant (rho = 0.74, P <0.01), although lower than correlation with the standard classification (rho = 0.90, P <0.01) and than with the "low-grade" and “high-grade" (rho = 0.98 P <0.01). To our knowledge this is the first study that uses diffusion-weighted MR sequences for the assessment of postoperative recurrence in patients with CD. Another correlation study, performed by the Vienna group, assessed the staging of postoperative recurrence with MRI in 27 patients (21 with complete endoscopic control), realizing a classification into 4 grades, from MR0 to MR3, by means data obtained using conventional parameters (contrast enhancement, mucosal thickening of the in-testinal wall, irregularity of the mucosal surface or full-thickness, T2 hyperintensity, stenosis and pre-stenotic dilatation).45
Data obtained from Sailer J et al.45collected as separate to the anastomosis and the neo-terminal ileum from 3 operators, compared to endoscopic evaluation, gave an overall agreement amounted to 77.8% (k = 0,673). When the data of the MR scores were further divided in MR "low-grade" (MR0 - MR1) and MR "high-grade" (MR2 - MR3), to distinguish between post-operative recurrence of low-grade (i1-i2) and that of high-grade (i3-i4), there was a concordance of 95.1% (k = 0.839).
Also in our study was carried out the same distinction between patients with low-grade and high grade recurrence, having a statistically significant difference between the mean of ADC values of respective group, and also an excellent correlation, obviously inverse, between endoscopic classification and quantitative assessment of ADC (rho 0.85, P <0.001).
Such subdivision, through the analysis of Receiver-Operating Characteristic (ROC) curves, allowed to calculate an ADC cut-off, equal to 1.82 x 10ˉ³ mm²/s, with a sensitivity of 88,9% (from 51.8 to 99.7, CI 95%) and a specificity of 83.3% (from 35.9 to 99.6, CI 95%) able to predict, for lower values, a post-operative relapse Rs> i2. This result seems to us very important since the presence of a diffuse aphthous ileitis with diffusely inflamed mucosa, equal to a Rutgeerts’ score i3, represents a significant landmark in the clinical management of CD patients, because it requires an intensification of medical therapy.
Furthermore, the detection of extramural complications, equivalent to a Rutgeerts’ score i4, may re-quire an additional surgery. It is also important to underline that in line with the cut-off used in our study to predict the presence of post-operative recurrence of high degree, other authors34,12 have found similar cut-off, respectively, 1.9 × 10ˉ ³mm²/s and 2.0 x 10ˉ ³mm²/s, capable of discriminating between active and non-active CD in the small intestine, with a sensitivity ranging from 84% and 86% and a specificity between 82% and 91%, while in Buisson’s study 35 an ADC<1.88 x 10⁻³ mm2/s was capable to distinguish superficial endoscopic ulcerations with a Se=64% and a Spe=75% and an ADC<1.42 x 10⁻³ mm2/s recognised endoscopic deep ulcers with Se=91% and Spe=83%.
Because in the calculation of the ADC cut-off value for high-grade recurrence diagnosis we must take into account the presence of a minimum percentage of inflammation, justifies the gap to the first values, while our data are in line with the Buissons study. The presence of a wide range including sensitivity and specificity is due to the sample size.
The results obtained in this study, the possibility of obtaining them without the infusion of contrast medium or bowel preparation, but above all the possibility that DWI sequences are able to provide quantitative measures, allowing a more objective assessment of the disease, make this method as well as being valid and reproducible, aviable in noncompliant patients or in which it is contraindicated administration of contrast, thus eliminating the risks associated with the administration of gadolinium. In fact, the sequences DWI, being equipped with a high intrinsic tissue contrast, could replace the T1 dynamics.
In our opinion, however, remains a fundamental need to get a good bowel distension and to correlate the findings of DWI sequences with those of MR enterography because the spatial resolution of DWI sequences is rather low and even a little bowel stretches can have high signal intensity.46
The limitations of our study are mainly related to the sample size who did not allow us to under-stand whether the quantitative evaluation by ADC could distinguish the presence of fibrosis in surgical specimens or even perform association studies to test whether patients with high grade recurrence were more frequently smokers, steroid-dependent or steroid-resistant, had been treated with medical or surgery therapy at first flare.
The possibility of obtaining quantitative measures could bring out a new "imaging biomarker" capable to monitor the progress/regress of the disease and the effectiveness of therapies introduced, at transmural, periodically comparing the parameters obtained in the same patient.
Despite the small sample, the results of our study are encouraging, but further studies on larger samples are needed to demonstrate that the addition of sequences DW-MRI may play an important role in the management of Crohn's disease and replace endoscopy. We hope that the DWI sequences will be included in study protocol and added to conventional morphological sequences as they can provide functional information and quantitative measures that cannot be obtained by other imaging modalities or with other traditional clinical indices.
None.
The authors declare there are no conflicts of interest related to the article.
None.

©2016 Samperi, et al. This is an open access article distributed under the terms of the, which permits unrestricted use, distribution, and build upon your work non-commercially.