
Research Article Volume 2 Issue 5
Stability graph using major geological structures
Javier Vallejos,1,2
Regret for the inconvenience: we are taking measures to prevent fraudulent form submissions by extractors and page crawlers. Please type the correct Captcha word to see email ID.

Roberto Miranda,1,2 Jean Azorin,2 Cesar Arriagada,1,2 Omar Catal n,3 Cristian Garrido,3 Michael Mondaca,3 Pablo Escares3
1AMTC, University of Chile, Chile
2Mining Engineering Department, University of Chile, Chile
3Lundin Mining, Chile
Correspondence: Javier Vallejos, Electrical Engineering Department, Santiago, RM, Chile, Tel +562 9787 1000,
Received: August 04, 2018 | Published: December 31, 2018
Citation: Vallejos J, Miranda R, Azorin J, et al. Stability graph using major geological structures. Fluid Mech Res Int J. 2018;2(5):243-246. DOI: 10.15406/fmrij.2018.02.00044
Download PDF
Abstract
Optimal stope dimension for underground mining using sublevel stopping method is decided ensuring excavation stability. This is done evaluating rock mass conditions during the whole mining period in order to reduce operational hazards thus ensuring continuous production. Mathew’s stability graph method is used as an analytical tool to achieve this purpose, but its original stability number has proven to be ineffective in the analysis of large scale slopes. Mathews B factor of joint orientation accounts for the influence minor discontinuities in the over break volume of slope’s walls. However, it does not reflect the scale difference between these discontinuities persistence and the slope’s size. Adverse oriented joint sets will imply low value B factor which will have a major effect on the stability number’s value while their actual influence on the slope’s wall over break may be immaterial. Major faults dimensions are comparable to large scale slope’s and thus their effect on these slopes over break volume is substantial compared to the one produced by the joints. This leads to the idea of calculating Mathew’s stability number using a B factor accounting for the effect of major faults in the stope wall’s over break.
Keywords: stability graph, sublevel stopping, mineroc, case study, stoping mines, rock mass behavior, compressive stress, re-calibrated, underground mine, rock mass, chilean sublevel, stoping mines, geotechnical, geological, potential excavation, exploited stopes
Introduction
Instability of the surrounding rock to underground mine openings is an ever-present threat to the safety of both people and equipment, this being this critical for sublevel stoping mines to ensure continuous production. Several tools, has been created to predict the rock mass behaviour, one of them is the empirical stability graph method developed by Mathews1 based on the shape factor, S, and the stability number, N. The shape factor is related to the geometry of the wall. Whereas, the stability number represents the characteristics of the rock mass.
S=AreawallPerimeterwall,N=Q`⋅A⋅B⋅C
- Q: is an adaptation of the rock tunneling quality index developed by Barton2
- A : is the rock stress factor obtained from the graph presented in the Figure1a. σc is the intact rock strength and
- σ1 is the induced compressive stress at the center of the wall.
- B: is the joint orientation adjustment factor and measure the relative difference in the dip between the stope surface and the critical joint set. (Figure1b)
- C: is the gravity adjustment factor and reflects the effect of orientation of the stope surface on its stability, under the influence of gravity. It can be determined from (Figure1c)

Figure 1 Mathews stability factors.
The following years different authors expanded the original database, re-calibrated the stability number factors and proposed new stability boundaries.3‒7 The most comprehensive one was developed by Mawdesley.8 It contains more than 400 open stoping case studies from over 38 mines in North America, Australia, and England (Figure 2). Despite the significant amount of data collected, Chilean open stoping case studies were not considered. Therefore, particular geotechnical conditions and operational standards for Chilean sublevel stoping mines, are not being truly represented in the literature stability graphs. The objective is to develop geotechnical guidelines for mine design that reflect the geotechnical/geological and mining conditions of an underground mining complex. This paper presents the results of an empirical stability study of exploited slopes in different sectors of an underground mining complex located in Atacama Region, Chile, using Mineroc to perform the back analysis of the stopes performance.

Figure 2 Extended stability graph.
- Mineroc9–11 is an underground mining application that allows mine planers to define the optimal stope size. In this software, the stability graph method can be adapted to a particular mining context, based on local case studies, geology, and different stability criteria. This is possible due to the interaction between different modules. In the first version of Mineroc9, four modules have been included
- Acquisition Module In this module, the required geotechnical information for the stability analysis can be stored. This information is contained in form of Geotechnical units and In-situ stresses and can be used in either the performance or the design module.
- Performance Module In this module, the back analysis of open stopes can be performed. This allows new open stoping case studies to be obtained. One of the key features of this module is the automatic calculation of performance parameters and Mathews adjustment factors per wall, the software calculates the area of the wall, the volume of the stope and the this last one corresponds to the volume between a wall and the Cavity Monitoring Survey (CMS)12 This is done through the comparison of triangulated design models and the resulting cavities post mining (the resulting cavity is scanned and a triangulated model is created). Of this way Mineroc can obtain either, the volumetric dilution and the ELOS per wall (Figure 3) (Figure 4).
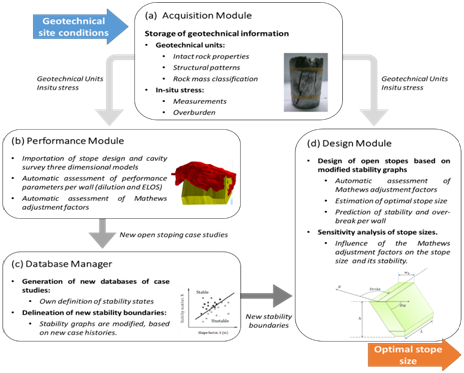
Figure 3 Interaction between modules and information flow in mineroc.

Figure 4 Section view of over break per wall.
Vol.Dilution=Overbreak of volume wallwall
ELOS=Overbreak of volume wallAreawall
- Database Manager this module, new local databases of open sloping case studies can be generated. New cases studies obtained in the performance module can be combined with databases from literature (included as consulting material for mines without own case studies) allowing new stability boundaries to be delineated.
- Design Module In this module, the design of new open stopes is performed. The stope dimensions are determined based on qualitative and quantitative stability graphs, using Geotechnical information, the In-situ stress and the stability boundaries.
Methodology
Different sectors from the mining complex were analysed in order to develop local stability curves. Information was compiled using Mineroc software, obtaining over-break volume, area and hydraulic radio per wall. These values are then used to calculate volumetric dilution of exploited stopes. The Stability Number N was obtained by analysing different geotechnical and geological parameters RQD,13 Joint set Number (Jr), Joint roughness number (Jr), Joint alteration number (Ja), UCS were assigned by the Geotechnical Unit of the slope’s surrounding rock. The A factor was calculated analysing the induced stresses obtained from the Stewart & Forsyth graphical method and the UCS,14 B factor was calculated using the angle between the orientation of major geological structure and the walls of the stope and the Gravity factor C is obtained analyzing the Dip angle of each wall (Figure 5).

Figure 5 Mineroc analyzing the walls of the stope.
Results
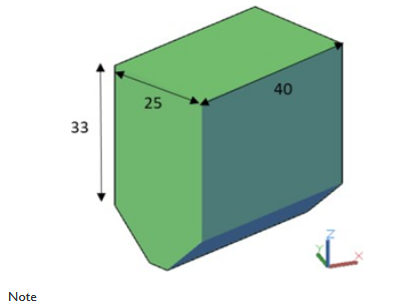
The database consisting of 709 walls (different CMS measurements were taken throughout the mining period of the stopes). The following figure presents the database and ELOS curves proposed for the mining complex (maximizing the PSS of the Curves11 This graph presents 3 stability curves describing areas characterized by ELOS 0.5m, 2m and 4m per wall (Figure 6). Evaluation of a new design using local stability curve. In order to evaluate a new potential excavation, Mineroc Software is equipped with a slope design module, this module estimates the stability number N (calculating Q', A, B and C factors) using the stored information from the mine and calculates the hydraulic radius for each of the walls based on the desired dimensions. The points (RH, N) are plotted on the graph identifying in which stability zone it shall be located. This process is done automatically to analyze the response of the design to variations of the geotechnical parameters and the stope geometry. The following example will explain the utility of local stability curves and how to obtain an estimated ELOS per wall (Table 1) (Figure 7). To obtain the stability number N, the site of the excavation is characterized by the following values, developing an overburden stress model in the site.15,16 As it is shown in (Table 2) (Figure 8) (Figure 9) the side walls are very close to ELOS 0.5m curve, the end walls are located above ELOS 2m curve and whereas the back of the store is located below ELOS 4m curve, being necessary to control the extraction.17‒21
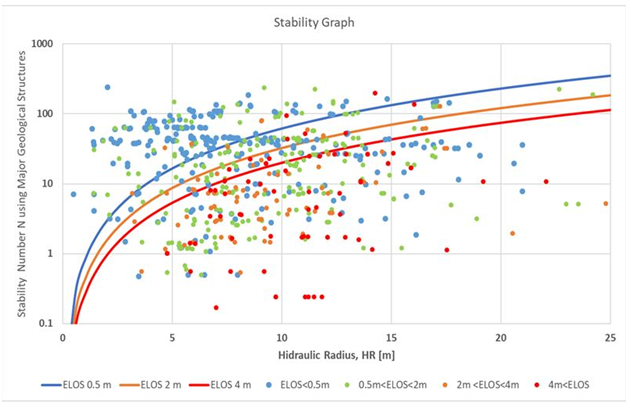
Figure 6 local stability curve
Geotechnical |
Information stress |
UCS50 [Mpa] |
253 |
RQD |
65 |
Jn |
12 |
Jr |
1.5 |
Ja |
1.5 |
Table 1 Geological faults
Wall |
ELOS |
Back |
4 m |
Hanging Wall (HW) |
0.5 m |
Foot Wall(FW) |
0.5 m |
End Wall 1 |
2 m |
End Wall 2 |
2 m |
Table 2 Geological faults
Dimention |
|
Long [m] |
40 |
Width[m] |
25 |
High [m] |
33 |
Dip [º] |
90 |
Strike [º] |
65 |
Depth[m] |
270 |
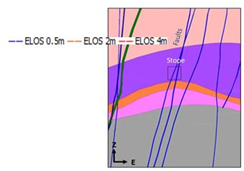
Figure 8 Surrounding geology
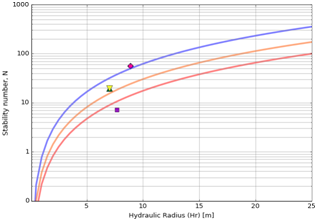
Figure 9 Evaluation of the slope stability
Conclusion
Among the main benefits of using the new local stability graph based on wall ELOS:
It is possible to obtain an estimation of the dilution of new designs based on curves proposed specifically for mining operations. As a result of the study, a standardized database with geotechnical / geological / mining information has been developed in order to analyze new designs. It is possible to identify similar conditions in terms of the rock mass quality (N) and dimensions (RH) of the new slope designs analysing how they would perform under similar conditions. The new guidelines allow the design of optimized stopes in terms of the expected ELOS using major geological structures compared to the original stability curves which are subjective. To control over-break and dilution in sublevel sloping methods, it is necessary to adapt the tools proposed in the literature to the local conditions of the mine. Mineroc software allows the automation and standardization of stability analysis (Table 3)(Table 4).
𝜎𝑍𝑍 |
0.038 *Depth [m] |
𝜎𝑁𝑆 |
0.053*Depth [m |
𝜎𝐸𝑊 |
0.053*Depth [m] |
Table 3 Geological faults
Dip [º] |
82 |
DipDir[º] |
265 |
Dip [º] |
71 |
DipDir[º] |
248 |
Table 4 Geological faults
New guidelines for mining design have been proposed based on a dilution criterion per wall:
- The largest over-break volumes occur mainly on the roofs of the slopes.
- The orientation of minor structures (diaclases) does not reflect the mechanism of failures that produces instabilities of large slopes, thus its being necessary to study in depth the behavior of major geological structures (faults and dikes), being this the first approach to develop a standardized method.
Acknowledgments
Conflicts of interest
The author declares that there are no conflicts of interest.
References
- Arjang B, Herget G. In Situ Ground Stresses in the Canadian Hardrock Mines: An Update. International Journal of Rock Mechanics and Mining Sciences. 1995;34(3–4):15.e1‒15.e16.
- Barton N, Lien R, Lunde J. Engineering classification of rock masses for design of tunnel support. Rock Mechanics and Rock Engineering. 1974;6(4):189‒236.
- Bieniawski Z. Rock mass classification in rock engineering. Exploration for rock engineering: proceedings of the symposium on exploration for rock engineering.1976;97‒106.
- Carter T. Guidelines for use of the Scaled Span Method for Surface Crown Pillar Stability. 1st International Conference on Applied Empirical Design Methods in Mining, Lima-Perú. 2014:34.
- Castro C. Numerical Modeling of Dilution by over-Break in Sublevel Stopping Underground Mining, Master Thesis. Santiago; Universidad de Chile. 2015.
- Clark L, Pakalnis R. An Empirical Design Approach for Estimating Unplanned Dilution from Open Stope Hangingwalls and Footwalls. In Proceedings of the 99th Annual General Meeting. Canadian Institute of Mining, Metallurgy and Petroleum Vancouver. 1997
- Deere D, Hendron A, Patton F et al. Design of surface and near-surface construction in rock. Proceedings of the 8th US Symposium on Rock Mechanics (USRMS), American Rock Mechanics Association. 1967;237‒ 302.
- Galarce T. In-Situ Stress Model Chile and Its Incidence in the Design of Underground Mines, Bachelor thesis. University of Chile. 2014
- Hoek E, Brown. E. Practical Estimates of Rock Mass Strength. International Journal of Rock Mechanics and Mining Sciences. 1997;8(34):1165–1186.
- Mathews KE, E Hoek, Stewart S. Prediction of Stable Excavation Spans for Mining at Depths below 1000 M in Hard Rock. CANMET DSS. 1980;0sQ80‒00081.
- Mawdesley C. Predicting Rock Mass Cavability In Block Caving Mines, PhD Thesis. Australia: University of Queensland. 2002
- Mawdesley CR, Trueman, Whiten WJ. Extending the Mathews Stability Graph for Open–stope Design. Mining Technology. 2001;110(1);27‒39.
- Miller F, Potvin Y, Jacob D. Laser Measurement of Open Stope Dilution. CIM(Canadian Mining and Metallurgical) Bulletin. 1992;85(962):96–102.
- Nickson SD. Cable Support Guidelines for Underground Hard Rock Mine Operations. University of British Columbia. 1992
- Pérez E, Vallejos JA, Miranda R. Adapting the stability graph method to specific site conditions in Mineroc. 1st International Conference of Underground Mining. 2016;150‒164.
- Potvin, Y. Influence of Stope Design on Stability of Hanging Wall Decline in Cibaliung Underground Gold Mine. Empirical Open Stope Design in Canada. In: Retrospective Theses and Dissertations. 1988;1919‒2007.
- Suorineni FT. The Stability Graph after Three Decades in Use: Experiences and the Way Forward. International Journal of Mining, Reclamation and Environment. 2010;24(4):307–339.
- Vallejos JA, Delonca A, Fuenzalida J et al. Statistical Analysis of the Stability Number Adjustment Factors and Implications for Underground Mine Design. International Journal of Rock Mechanics & Mining Sciences. 2016;87:104‒112.
- Vallejos JA, Miranda O, Gary C, et al. Development of an integrated platform for stability analysis and design in sublevel stoping mines — MineRoc®. Australian Centre for Geomechanics. 2015;477‒488.
- Vallejos JA, Miranda R, Burgos L. Development of new design tools for open stoping underground mines. Arma. 2016;150‒164.

©2018 Vallejos, et al. This is an open access article distributed under the terms of the,
which
permits unrestricted use, distribution, and build upon your work non-commercially.


