The purpose of this work is to provide a method for the design of an axial flow compressor stage. This latter represents the front stage of a multistage compressor of industrial gas turbine. The proposed 2D design approach is based on the mean line concept which assumes that mean radius flow conditions prevailing at all other radial stations. The different conservation equations of fluid mechanic; mass, momentum, and energy with ideal gas state equation are applied in conjunction with the NASA empirical relations to compute both incidence and deviation angles at design condition. A FORTRAN computer program was implemented with the inputs such as mass flow rate, tip speed, pressure ratio, ambient temperature and pressure under larger flow coefficient and high reaction ratio. Design process begins with calculation of the channel geometric form from inlet to outlet stage. Thermodynamic properties of the working fluid are determined at rotor inlet, stator outlet and the intermediate station. Detailed geometry of the cascade; chord, pitch, camber and stagger angle is identified for both rotor and stator. The generation of the blade coordinates is performed on the basis of NACA65 profile with circular mean camber line.
Keywords: design, meanline design, axial compressor, stage, NACA65, circular camber
The necessity of industrial gas turbine power plants increases with the rise demand of electricity. It represents one of the most important plants in the energetic engineering field. Generally, gas turbine incorporates three main parts: compressor, combustion chamber and turbine. These parts forms the Brayton thermodynamic cycle used in either electricity production in residential and industrial areas or thrust generation in the aviation field. Compressor has the primordial role because high efficiency of the gas turbine is strongly connected to the pressure ratio delivered by the compressor. A lot of works were carried out in the field of design and analysis of axial compressors. However, to understand all details and ideas, from these works, leading to design the axial compressor and give the detailed geometric form of blading, hub, casing and its different parts, a tedious work will be devoted. The purpose to model compressor stage, on the basis of empirical correlations and thermodynamic relations, is to provide the detailed geometry in order to use it in the analysis process and avoiding the CFD approach which consumes a long time during the calculation in the design operation. In fact, this paper represents a tentative in this field for designing an axial compressor stage using the one-dimension mean line approach based on constant outer diameter design.
Before starting the calculation, different input parameters are required to carry out the design of axial compressor stage.1,2 These parameters could be classified through three sets:
Main specifications
The compressor stage that will be calculated is qualified constant outer diameter (COD). The stage is designed without inlet guide vane and delivers a pressure ratio
with a mass flow rate m=170kg/s. Among the main non-dimensional design parameters which are used to give the overall shape of velocity triangles; flow coefficient
, and reaction ratio
. The diffusion factor for both rotor and stator equal to 0.5.
Detailed specifications
The following Table 1 shows the detailed specification used to carry out the preliminary design calculations for the axial flow compressor stage.
Detailed specifications |
Rotor |
Stator |
Aspect ratio AR |
2.5 |
3.5 |
Tip clearance
|
0.02 |
0.02 |
Relative thickness t/c |
0.1 |
0.1 |
Axial velocity ratio AVR |
0.99 |
0.99 |
Blockage factor BF |
0.98 |
0.98 |
Table 1 Input parameters for detailed specifications
Inlet specifications
In fact, the first stage blades, being the longest, are the most highly stressed. Therefore, the security threshold considered by the designer for which the stress problems are not usually critical in the sizing of the annulus is the tip speed of around 350m/s. The same considerations of the stress problems lead to choose relatively low hub-tip ratio in order to decrease the blade stresses; rth=0.5. Concerning the stagnation conditions at inlet, the ambient air temperature T0=288K and ambient pressure P0=1.01325bar. The absolute inlet air angle is set to 15 degrees.
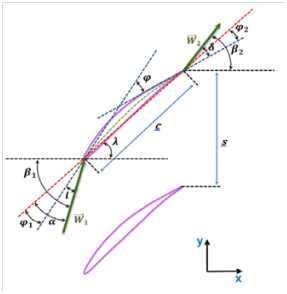
A multistage axial compressor as its name indicates, it consists of several stages. Each stage includes two main parts: a moving part called rotor and stationary part named stator.3 Upon both rotor and stator, a set of blades attached to the drum for the latter and on the casing for the former. Concerning the inlet guide vane, it is not regarded as a part of the first stage and it is treated separately. The transfer of energy is assured by the rotor and the stator contributes to transform the kinetic energy to pressure potential energy.4 The total enthalpy remains constant in the stator since there is not a work given to fluid. Figure 1 shows a sketch of typical compressor stage with T-S diagram.6 Figure 2 illustrates the cascade geometry.7

Figure 1 T-S diagram of the compression process in the stage.

Figure 2 Cascade geometry.
Inlet geometry calculation
With the aim to calculate the inlet geometry, the velocity Ca1 at stage inlet should be known. In our calculation this velocity is unknown; therefore, an iterative process must be used. By giving an initial value for Ca and using the equations cited in the following algorithm, the calculation is performed and repeated until convergence is reached. The inlet flow velocity and inlet geometry are calculated.8
Algorithm:
- Assume Ca
- Calculate the following parameters: C, at, Mt, M, P, T, A, rt, rh, rm, Um
- Calculate
- If
then
is adopted
- Else go to step 2 and repeat the process until convergence
Where :
C, at, Mt, A, rt, rh, rm, Um represent the axial velocity, tip speed of sound, tip Mach number, cross section area, tip radius, hub radius, mean radius and blade speed at mean radius, respectively.
Exit geometry calculation
Adopting the type of compressor stage COD where the tip radius is kept constant and after the estimation of the inlet geometry, it is able now to estimate the channel geometric form at exit of the stage. According the compressor stage pressure ratio π, the total pressure and total temperature at exit are expressed as:
(1)
(2)
Using the following algorithm, we can find the geometry at exit stage.
- Calculate Ca at exit
- Assume Um3
- Calculate the following parameters at exit: C, Mt, M, A, rt, rh, rm
- Calculate
- If
then
is adopted
- Else go to step 3 and repeat the process until convergence
where
,
and
represent the revolutions per minute, the stage efficiency and the convergence error, respectively.
Computation of air angles and kinematic properties
We note that the dimensionless velocity triangles and the blade shape required to achieve them are totally determined by the flow coefficient
loading coefficient
and the reaction ratio
(Table 2). Therefore, all angles and velocities may be expressed as functions of
Geometric properties |
Rotor inlet (1) |
Station rot_stat (2) |
Stator outlet (3) |
Absolute flow angle
|
15 |
41.18 |
15 |
Relative flow angle
|
49.25 |
28.97 |
- |
Tip radius rt(m) |
0.808 |
0.808 |
0.808 |
Mean radius rm(m) |
0.639 |
0.653 |
0.668 |
Hub radius rh(m) |
0.404 |
0.448 |
0.489 |
Absolute velocity C(m/s) |
93.59 |
122.86 |
97.87 |
Relative velocity W(m/s) |
138.5 |
105.07 |
- |
Table 2 Geometric and kinematic properties
Computation of static and total properties
The relationship between stagnation and static properties of the flow are expressed as follows:
For temperature;
(3)
For pressure;
(4)
The computed parameters are summarized in the following Table 3
Properties |
Rotor inlet (1) |
Station rot_stat (2) |
Stator outlet (3) |
Static temperature T(K) |
283.63 |
293.7 |
300.02 |
Static pression P(Pa) |
96052.35 |
113842.04 |
115079.99 |
Static Mach number M |
2.77 |
3.57 |
2.81 |
Static enthalpie H(KJ/kg) |
284912,42 |
295024.24 |
301373 |
Total temperature Tt(K) |
288 |
304.77 |
304.77 |
Total pression Pt(Pa) |
101325 |
124347 |
121590 |
Total Mach number Mt |
2.75 |
3.5 |
2.79 |
Total enthalpie Ht(KJ/kg) |
289296 |
306149 |
306149 |
Table 3 The computed parameters
Balding/ blades design
To calculate the blade angles, an iterative procedure is required with assuming an initial value for the blade camber angle. Using this value of the blade camber angle, the design incidence angle and the design deviation angle are computed. From these calculated values of incidence and deviation, a new value of camber angle is obtained and compared with the assumed value. This process is repeated until convergence.
Pitch chord or solidity
The knowledge of the value of solidity
or the pitch chord
is necessary in the calculation of both incidence and deviation. There are several approaches to determine the pitch chord of the cascade. Among these approaches, the McKenzie method which is expressed in term of static pressure ratio Cp as following:
(5)
(6)
Design incidence
Incidence angle represents the difference between the inlet flow angle and the inlet blade angle at the leading edge. For a given cascade, experimental tests lead to obtain the variation of the loss coefficient with respect to the incidence. Over a wide range of incidence angle, it exists a reference value of incidence angle which corresponds to the minimum loss. This value is called design incidence. NASA SP36 empirical relations are the most widely used to predict design incidence. Using Lieblein approach, the pressure loss at twice the minimum loss defines the operability range located between positive stall incidence and negative stall incidence. Outside this region, the blade remains under stall phenomena. The method for calculating the optimum incidence for different profiles shape such as thickness, camber and solidity is guided by the following correlation:
(7)
where :
and
are thickness and shape correction factors, respectively.
differs whether the blade is DCA, NACA65-series or C-series. For example,
for NACA65 profile.
is calculated as a function of cascade thickness:
(8)
is the zero camber minimum loss incidence for 10% thickness NACA65-series:
(9)
n is the slope of the variation in incidence with camber angle
. NACA SP36 curve fits give the below expression:
(10)
Design deviation
Deviation angle is the difference between the outlet blade angle and exit flow angle at trailing edge. It arises from the effect of boundary layer growth on the suction side towards the trailing edge pushing the streamline away from the airfoil surface. A very similar correlation to that of the reference incidence angle is used to calculate the design deviation angle:
(11)
For deviation, the shape correction factor
is used with the same formulation as in reference incidence. The thickness correction factor
is expressed with another form:
(12)
is the deviation angle based on 10% thickness blades.
(13)
The variable m represents the deviation slope factor:
(14)
b is given by:
(15)
For 65-series blades :
(16)
Computation of blade angles
The calculation of the blade angles follows the steps of this program:
- Guess
- Calculate
- Calculate
- Calculate
and
- Calculate
- If
then
is adopted
- Else go to step 2 and repeat the process until convergence
Blade profile design
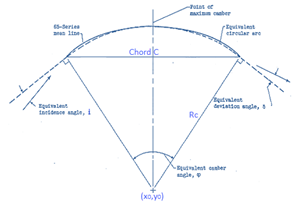
Low subsonic flow regime in the corresponding compressor stage allows to use NACA65-series profile. The circular arc camber line is commonly used as an effective camber line for NACA65-series blades to provide a meaningful definition of leading and trailing edge blade angles. Generally, blade profile is constructed by superimposing prescribed thickness distribution upon the designed camber line. NACA65 thickness distribution is chosen on circular arc mean camber line with 10% maximum relative thickness t/c. The relations used to build the mean camber line and the thickness distributions are obtained from Angier.9 The Figure 3 illustrates the geometric details concerning the circular arc camber line.

Figure 3 Circular arc mean camber line.9
The radius of the mean camber line depends on the blade chord and the camber angle φ according to the following relation:
(17)
The coordinates of the mean camber line are then determined from:
(18)
Where x0 and y0 are the coordinates of the origin of the curvature radius; n isthe number of nodes used upon suction side and pressure side and j is the order of the node.
The half thickness shape yt may be used from the tabulated base profile data to calculate the coordinates of the profile points on both suction and pressure side8
(19)
(20)
is the local slope of the camber line.
The detailed geometry of the cascade blades of both rotor and stator is given. This geometry corresponds to the blade section at mean radius. The different geometric properties; blade chord length (c), cascade pitch (s), mean blade height (h), number of blades (N), and the different blade angles; incidence angle (i), deviation angle
, inlet blade angle
, outlet blade angle
and the camber angle
are shown in the following Table 4
|
c(m) |
s(m) |
h(m) |
N |
|
|
|
|
|
Rotor |
0.152 |
0.189 |
0.382 |
13 |
-2.35 |
5.99 |
51.6 |
22.97 |
28.64 |
Stator |
0.0969 |
0.118 |
0.34 |
18 |
-3.07 |
7.64 |
7.64 |
7.35 |
36.92 |
Table 4 Geometry cascade at mean radius
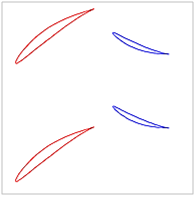
In the below Figure 4 we illustrate the geometry of the blades in 2D linear cascade where the rotor and stator are represented with red and blue, respectively. The axial distance between the stator and rotor is calculated from the following expression
(21)

Figure 4 2D Geometry cascade at mean radius of the stage.
This work is aimed to present a methodology for an axial compressor stage design using the mean line approach with constant outer diameter configuration COD. A FORTRAN code is developed and implemented to reach this preliminary design based on common thermodynamics and aerodynamics principles. The different properties at three stations; rotor inlet, stator outlet and intermediate face, are calculated. The detailed geometry of the cascade based on the NACA65 profile with circular arc camber line is obtained using NASA empirical relations. The obtained geometry will be exploited as input data in the analysis process to predict axial compressor stage performance curves, using either one dimensional mean streamline method or CFD approach, and also in the structured analysis.


