This study was under taken in the U.G. thesis work in the Dept. Of SWCE, CAET, OUAT, Bhubaneswar during the year 2018-19. Bargarh district has latitude of 21.3oN and a longitude of 83.6oE. The average rainfall at Bargarh district is around 1337.5 mm, though it receives high amount rainfall but most of the rainfall occurred during kharif. So most of the crops get low yield due to improper crop planning. Thus, this study is proposed to be undertaken with the following objective: Probability analysis of annual, seasonal and monthly rainfall data of Bargarh district. So rainfall data were collected from OUAT, Agril Meteorology Dept. from 2001 to 2017(17 years) monthly, seasonal and annual rainfall were analyzed .Probability analysis have been made and equations were fitted to different distributions and best fitted equations were tested. Monthly, Annual and seasonal probability analysis of rainfall data shows the probability rainfall distribution of Bargarh district in different months, years and seasons. It is observed that rainfall during June to Sep is slightly less than 1000 mm and cropping pattern like paddy(110 days) may be followed by mustard is suitable to this region. Also if the kharif rain can be harvested and it can be reused for another rabi crop by using sprinkler or drip irrigation, which will give benefit to the farmers. Annual rainfall of Bargarh district is 1337.5 mm at 50% probability level.
Keywords: rainfall, probability analysis, crop planning
Bargarh district has a total geographical area of 4325 sq. km. Bargarh district has latitude of 21.3oN and a longitude of 83.6o E. The average rainfall at Bargarh district is around 1337.5 mm, most of the rainfall occurred during kharif. Thus, this study is proposed to be undertaken with the following objective: Probability analysis of annual, seasonal and monthly rainfall data of Bargarh district.
Thom1 employed mixed gamma probability distribution for describing skewed rainfall data and employed approximate solution to non-linear equations obtained by differentiating log likelihood function with respect to the parameters of the distribution. Subsequently, this methodology along with variance ratio test as a goodness- of-fit has been widely employed Kar et.al.,2 Jat et.al.,3 Senapati et.al.4 applied incomplete gamma probability distribution for rainfall analysis. In addition to gamma probability distribution, other two-parameter probability distributions (normal, log-normal, Weibull, smallest and largest extreme value), and three-parameter probability distributions (log-normal, gamma, log-logistic and Weibull) have been widely used for studying flood frequency, drought analysis and rainfall probability analysis Senapati et.al.4
Gumbel,5 Chow,6 have applied gamma distribution with two and three parameter, Pearson type-III, extreme value, binomial and Poisson distribution to hydrological data.
The data were collected from District Collector’s Office, Gajapati district for this study. Rainfall data for 17 years from 2001 to 2017 are collected for the presented study to make rainfall forecasting through different methods.
Probability distribution functions
For seasonal rainfall analysis of Gajapati district, three seasons- kharif (June-September), rabi (October to January) and summer (February to May) are considered.
The data is fed into the Excel spreadsheet, where it is arranged in a chronological order and the Weibull plotting position formula is then applied. The Weibull plotting position formula is given by
where m=rank number
N=number of years
The recurrence interval is given by
The values are then subjected to various probability distribution functions namely- normal, log-normal (2-parameter), log-normal (3-parameter), gamma, generalized extreme value, Weibull, generalized Pareto distribution, Pearson, log-Pearson type-III and Gumbel distribution. Some of the probability distribution functions are described as follows:
Normal distribution
The probability density is
where x is the variate, is the mean value of variateand is the standard deviation. In this distribution, the mean, mode and median are the same. The cumulative probability of a value being equal to or less than x is
This represents the area under the curve between the variates of
and
.
Log-normal (2-parameter) distribution
The probability density is
where y =ln x, where x is the variate,
is the mean of y and
is the standard deviation of y.
Log-normal (3-parameter) distribution
A random variable X is said to have three-parameter log-normal probability distribution if its probability density function (pdf) is given by:
>
where
are known as location, scale and threshold parameters, respectively.
Pearson distribution
The general and basic equation to define the probability density of a Pearson distribution
where
are constants.
The criteria for determining types of distribution are
where
Where
are second, third and fourth moments about the mean.
Log-pearson type III distribution
In this the variate is first transformed into logarithmic form (base 10) and the transformed data is then analyzed. If X is the variate of a random hydrologic series, then the series of Z variates where
are first obtained. For this z series, for any recurrence interval T and the coefficient of skew
Standard deviation of the Z variate sample
=
And
coefficient of skew of variate Z
=
= mean of z values
N= sample size = number of years of record
Generalized pareto distribution
The family of generalized Pareto distributions (GPD) has three parameters
.
The cumulative distribution function is
for
when
and
when
where
is the location parameter,
the scale parameter and
the shape parameter.
The probability density function is
Or
again, for
, and
when
The various parameters like mean, standard deviation, RMSE value were obtained and noted for different distributions. The rainfall at 90%,75%,50%,25% and 10% probability levels are determined. The distribution “best” fitted to the data is noted down in a tabulated form in Table 1.
|
Months
|
Best-fit Distribution
|
RMSE Value
|
Rainfall at probability levels
|
|
90%
|
75%
|
50%
|
25%
|
10%
|
|
January
|
Log-normal
|
0.07683
|
-
|
-
|
-
|
5.46
|
31.32
|
|
February
|
GEV
|
0.04701
|
-
|
-
|
-
|
22.06
|
31.38
|
|
March
|
Pareto
|
0.0364
|
-
|
-
|
-
|
11.55
|
48.59
|
|
April
|
Gamma
|
0.0571
|
-
|
-
|
-
|
11.9
|
39.14
|
|
May
|
Pareto
|
0.03027
|
-
|
-
|
15.17
|
40.7
|
63.62
|
|
June
|
Ln (3-P)
|
0.03107
|
80.68
|
137.19
|
218.36
|
314.97
|
411.85
|
|
July
|
Weibull
|
0.05611
|
180.67
|
251.28
|
362.57
|
523.20
|
728.02
|
|
August
|
Ln (3-P)
|
0.03107
|
179.11
|
238.68
|
328.25
|
451.33
|
601.15
|
|
September
|
Normal
|
0.05611
|
57.05
|
130.78
|
212.73
|
294.70
|
368.54
|
|
October
|
Pareto
|
0.04727
|
-
|
12.14
|
32.89
|
67.78
|
112.76
|
|
November
|
Gamma
|
0.07268
|
-
|
-
|
-
|
4.85
|
26.96
|
|
December
|
Pareto
|
0.08277
|
-
|
-
|
-
|
-
|
22.88
|
|
Annual
|
Pareto
|
0.03024
|
979.21
|
1110.60
|
1337.5
|
1579.98
|
1740.39
|
|
Kharif (june-sept)
|
Pareto
|
0.05472
|
904.97
|
997.77
|
1177.7
|
1415.67
|
1631.67
|
|
Rabi (oct-jan)
|
Pareto
|
0.03717
|
-
|
16.4
|
53.1
|
106.38
|
161.89
|
|
Summer (feb-may)
|
Ln (3-P)
|
0.03541
|
-
|
13.61
|
47.4
|
80.93
|
116.22
|
Table 1 Rainfall analysis of Bargarh Block at different probability levels for different months and seasons
In the present study, the parameters of distribution for the different distributions have been estimated by FLOOD-flood frequency analysis software. The rainfall data is the input to the software programme. The best fitted distribution of different month and season and annual were presented in Table 1. The annual rainfall in 50% probability was found to be 1337.5 mm for Bargarh district of Odisha. During Kharif at 50 % probability level, the rainfall is 1177.7 mm where as only 53.1 mm and 47.4 mm was received during rabi and summer respectively.
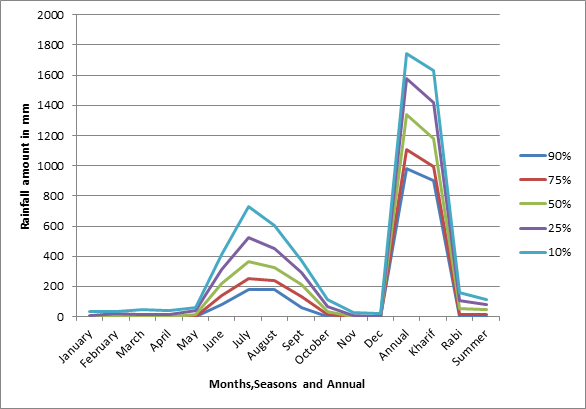
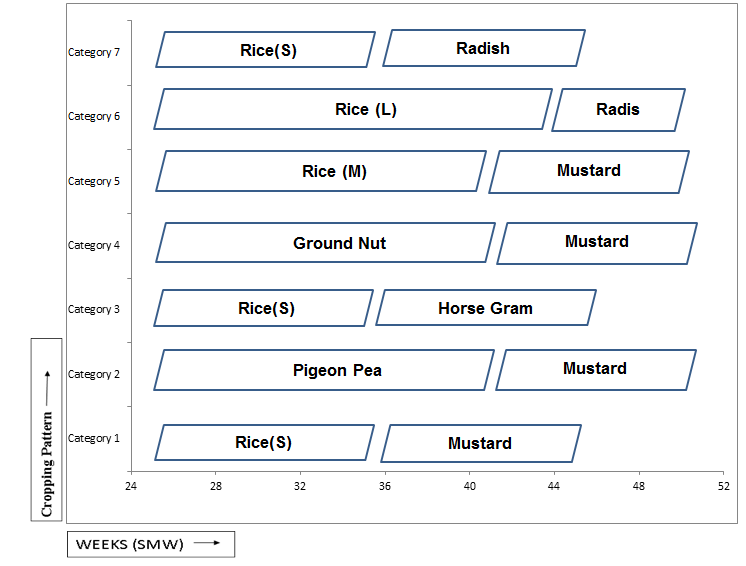
In the present study, the parameters of distribution for the different distributions have been estimated by FLOOD-flood frequency analysis software. The rainfall data is the input to the software programme. The best fitted distribution of different month and season and annual were presented in Table 1. The annual rainfall in 50% probability was found to be 1243.8 mm for Bargarh district of Odisha. During Kharif at 50 % probability level, the rainfall is 1177.7 mm where as only 53.1 mm and 47.4 mm was received during rabi and summer respectively, so water harvesting structures may be made to grow crops during rabi and summer to utilize the water from the water harvesting structures to increase the cropping intensity of the area. It is also observed that at 75 % probability level the June ,July , Aug and Sept received more than 100 mm, so farmers of these area can grow crops in upland areas suitably paddy can be grown followed by any rabi crop in rabi season like mustard or kulthi in upland areas. In Figure 1 the plot between different months and amount of rainfall in different probabilities were shown, It is observed that September month gets highest amount of rainfall compared to other months. Figure 2 shows the different cropping pattern in Bargarh district as per the rainfall available in different weeks.7-17

Figure 1 Rainfall at different probabilities of monthly, seasonal and annual at Bargarh block.

Figure 2 Different cropping patterns for Bargarh district.


