Advances in
eISSN: 2572-8490


Research Article Volume 4 Issue 4
Department of Bioengineering, University of California, Los Angeles, USA
Correspondence: Bill Tawil, PhD, 420 Westwood Plaza, Room 5121, Engineering V. P.O. Box: 951600 Los Angeles, CA 90095-1600, USA
Received: August 13, 2018 | Published: December 11, 2018
Citation: Ganapa TBS, Iyer KBS, Yindeeyoungyeon VBS, et al. Novel approach to deliver cells in fibrin beads. Adv Tissue Eng Regen Med Open Access. 2018;4(4):112-122. DOI: 10.15406/atroa.2018.04.00088
There are many approaches to deliver cells to treat wounds, but a very recent approach is to deliver cells by allowing them to adhere to the outside of 3D fibrin beads. Previous models use the fabrication methods of these fibrin beads that involve heat and potentially harmful solvents. In this study, we were able to create a novel approach to deliver cells by incorporating the cells inside the 3D fibrin beads without the use of harmful solvents or heat. In this novel technique, fibroblasts and keratinocytes were encapsulated within the fibrin microbeads and the migration and proliferation of these cells on 3D collagen constructs or in the newly established 3D wound healing model (paper in progress) were examined for up to 1 week. Three different models for fibrin analysis were created and examined: fibrin beads containing cells of either keratinocytes or fibroblasts on a cell culture plate, beads on a layer of 3D fibrin constructs of different fibrinogen and thrombin concentrations, and finally the fibrin beads were placed between two layers of 3D fibrin constructs. The results for cell migration and proliferation showed that each cell behaves differently on certain surfaces. Fibroblasts and keratinocytes incorporated in fibrin beads migrated and proliferated best on the culture dishes. Both cell types migrated the slowest when the fibrin beads containing these cells were placed between 2 layers of 3D fibrin constructs by average of 60 and 95 micrometers, respectively. In conclusion, using this novel approach of delivering cells using fibrin beads is a tunable microenvironment that sustains and optimizes the performance of each cell type implanted into a wound-healing model. For future work, these microbeads will be implanted into a more realistic wound-healing model which will lead to a greater understanding in the wound healing field.
Keywords: fibrinogen, collagen, fibronectin, osteogenic, differentiation, cell growth
The wound healing process involves a cluster of interdependent cells and growth factors. Various cell types migrate to the wound site at different periods after an injury, have different roles, and also communicate with one another by secreting cytokines.1 The wound healing process comprises of four stages: hemostasis, inflammation, proliferation and remodeling.1 If one of these stages is disrupted, chronic wound forms and the wound will not be healed properly.2 To successfully close a wound, fibroblasts and keratinocytes must proliferate and migrate in coordinated fashion deposing extracellular matrix and tissue genesis during the proliferation phase.3 Most chronic wounds remain in the inflammatory phase and rarely transition to the proliferation phase.2
Chronic wounds are harmful to a patient’s health because they do not observe the normal healing stages and time span, and better wound healing models are needed to solve chronic wound issues. Though the wound-healing process has been studied for many years, we still do not fully understand the process. Thus, many types of models have been created to investigate and study wound healing components such as growth factors, cell morphology and migration. In vitro wound healing models are divided into 2 dimensional models and 3 dimensional models. 2D scratch assays measure cell migration in monolayers and do not account for the complex elements of the wound healing microenvironment such as cell-matrix interactions.4 On the other hand, 3D models that integrate cells inside or on top of a matrix provide a more comprehensive perspective of communication between cells and extracellular matrices.5 However, these current 3D wound healing models only utilize one type of cell and one type of extracellular matrix. We have previously shown that co-cultured human fibroblasts and keratinocytes in a 3D fibrin construct yield different results than culturing each cell alone in the fibrin construct.6 Therefore, cell-cell interactions are critical, and to accurately study the wound healing process using in vitro models, more than one cell type should be included. In addition to multiple cell types, fibrin microbeads are utilized as carriers to localize each cell in our in vitro models.
Fibrin has long been a notable factor in delivery of cells and growth factors.7 Since fibrin is a biocompatible and biodegradable biomaterial,8 many cells type such as fibroblasts and keratinocytes can be maintained, grown, migrated and differentiated with the support of fibrin during in vitro studies.6 Fibrin is also very easy to physically manipulate. The structure, mechanical properties, and degradation of three-dimensional polymerized fibrin constructs can be modified.8 Manipulation of fibrin can also alter cell migration. Cell migration is largely dependent on the function of integrins, which are trans-membrane proteins that connect the actin cytoskeleton of a cell to the extracellular matrix (ECM).7 Integrins induce cell motility in response to mechanical cues such as the tensile strength of the cell’s environment or biochemical cues such as the activation of β3 integrins in the presence of fibrinogen.7 By modifying the tensile strength, size, or porosity of a fibrin construct, cell migration can be altered.9 Fibrin microbeads were invented as biodegradable carriers for culturing cells and isolating mesenchymal cells.10 In the Gorodetsky studies, fibrin micro beads were made by an oil emulsion method, which involved corn oil, isooctane, hexane and 95% ethanol.10 Based on our previous experiments (data not shown), the oil layer is difficult to completely remove from the surface of the beads. Since fibroblasts cells were coated outside of the fibrin beads, the leftover organic solvents may have affected the viability of the cells, and researchers were unable to ensure a gradual release of cells or growth factors at an optimum level. In this paper, we introduce a new method of making fibrin beads, which integrates cells throughout the beads, and does not involve any organic solvents. We also observed the migration and proliferation of fibroblasts and keratinocytes inside the fibrin microbeads on different surfaces. For improving in vitro wound healing model, these fibrin microbeads will provide cell-cell interaction as well as cell-matrix interactions to wound healing models and lead to greater understanding in the field.
Cell culture
Human foreskin fibroblast (HFFs) lines from ATCC (Manassas, VA) were cultured in Dulbecco’s modified Eagle’s Medium (DMEM) from CellGro (Manassas, VA) with 4.5mg/mL glucose (Sigma Aldrich. St Louis, MO), 10% fetal bovine (Sigma Aldrich St Louis, MO) and 5% penicillin/streptomycin (Sigma Aldrich St Louis, MO) in an 5% CO2 incubator (Sigma Aldrich St Louis, MO) at 37°C. Normal human epithelial keratinocytes (NHEK) (Clonetics–BioWhittaker, Walkers- ville, MD) were cultured in keratinocyte serum-free media (GIBCO) in 5% CO2 incubator at 37°C. Cells were passaged to new flasks upon reaching confluency. Media was renewed twice a week, and the passage numbers of fibroblasts and keratinocytes were between 1 and 15.
Fabrication of fibrin beads with encapsulated fibroblasts or keratinocytes
Fibrinogen ((Tisseel™, Baxter Healthcare Corp., BioScience, Westlake Village CA) was diluted with Tris-buffer saline solution (TBS; Sigma, St. Louis, MO) to 5, 10, or 20 mg/ml concentration. Thrombin (Sigma Aldrich St Louis, MO) was diluted with 30mM CaCl2 (Sigma Aldrich St Louis, MO) in TBS (Sigma Aldrich St Louis, MO) to 5, 10, or 20 IU/ml concentration. Fibroblasts or keratinocytes were trypsinized by TrypLE Select (Gibco), and stained with Vybrant DiO (Invitrogen, Carlsbad, CA). After staining, a cell pellet of a 1,000,000 cells/ml density was obtained in a conical tube. Diluted fibrinogen was then added to the conical tube and mixed with the cell pellet. 20 microliters of cell-diluted fibrinogen was transferred and pipetted on the chosen surfaces to create a small bead and 20 microliters of diluted thrombin was pipetted and mixed with the bead. The total volume of each bead is 40 microliters. The cell-fibrin bead can be place into one of three setups: on the flat, 2D plastic surfaces of a 24-well plate, on a 2D fibrin surface, or inside 3D fibrin construct (Figure 1) as described below.
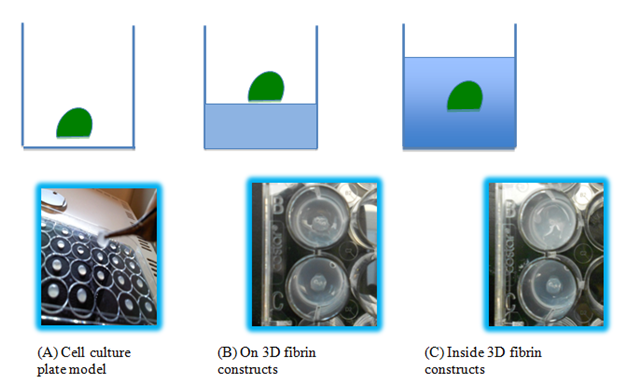
Figure 1 The three models of fibrin beads examined. (A) The fibrin beads are pipetted directly onto a cell culture plate. (B) The fibrin beads are pipetted onto a layer of fibrin to see how the cells inside the bead interact with the fibrin to migrate and proliferate. (C) The fibrin beads are pipetted on a fibrin layer, and another layer of fibrin is placed on top after the bead is allowed to polymerize. The thickness of this model is about 3.5 centimeters.
Experimental setups of the cell culture plate, beads on 3D fibrin constructs, and beads inside 3D fibrin constructs
For the cell culture plates, the bead was made per the procedure above and pipette directly on the plate surface. Beads on the 3D fibrin constructed were created by placing the cell-fibrin bead sits on top of a fibrin layer. To create a fibrin layer, 250 microliters of diluted fibrinogen was pipetted into a well of 24-well plate, and then 250 microliters of diluted thrombin was pipetted into the same well. The plate was left in the culture hood for 15 minutes to obtain a dry polymerized fibrin layer. Afterward, a fibrin microbead with encapsulated fibroblasts or keratinocytes was added on top of the fibrin surface. To create the bead, 20 microliters of cell-diluted fibrinogen was pipetted on plastic surface of a 24-well plate, and 20 microliters of diluted thrombin was pipetted and mixed into the bead afterward. Dilutions of 5, 10, and 20 ug/mL were used for both fibrinogen and thrombin, and all combinations of the mixture were used for migration and proliferation analysis. The cells inside 3D fibrin construct setup involves a fibrin bead in between of two layers of fibrin, and was fabricated with a similar protocol to 2D fibrin surface setup. After obtaining a dry polymerized fibrin layer and a fibrin microbead using the same procedures as the 2D fibrin surface setup, another fibrin layer was added on top of the bead with a mixture of 250 microliters of diluted fibrinogen and 250 micro liters of diluted thrombin.
Fibroblast and keratinocyte proliferation inside fibrin microbeads
Proliferation assays were quantified at day 1, 3 and 7 time points. For each time point, supernatant inside of a well was removed, and incubated with 500 μL of a 10% alamarBlue® (Thermofisher Canoga Park, CA) and 90% media solution at 37°C for four hours. Each 100 uL assay of media was aliquoted to a 96-well plate. A multiwell plate reader (Inifinite® F200; Tecan Group Ltd., Männedorf, Switzerland) with fluorescent intensity at 535 nm excitation and 595 nm emission was used to analyze and calculate cell proliferation.
Bright-field and fluorescent imaging of cell migration
The media was aspirated out prior to imaging then the fibrin microbeads were observed using an Olympus IX71 fluorescent microscope and cellSens imaging software at day 0,3,5,7,10,12 and 14 time points. Day 0 was treated as a reference point for comparison to the results of subsequent time points. The peripheral of the bead was divided into approximately 6-8 sections, and the same sections were imaged under the microscope for each time point. Green fluorescent images were used to confirm cell viability and bright-field images were used for observing cell morphology and migration. We quantified cell migration out of the fibrin microbeads by calculating the distance from fibrin beads’ peripheral to the migrated cells with ImageJ software. Since a great amount of fibroblasts or keratinocytes (1,000,000 cells/ml) were integrated inside the fibrin microbeads, the size of the fibrin microbeads shrunk over time throughout the experiment due to cell pulling characteristics. To achieve an accurate migration distance despite the moving boundary of the fibrin microbeads, the difference of the bead radii between the reference time point and the current time point was subtracted from the average measured migration distance of the current time point. The average rate of migration was then calculated by the difference of the distance between two time points, and divided by the time interval (Figure 2–7).
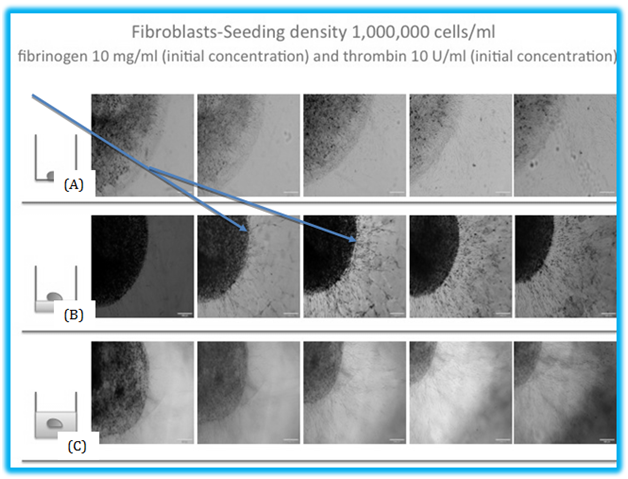
Figure 2 The migration of fibroblasts in fibrin beads. (A) The migration of fibroblasts inside a fibrin bead on a cell culture plate. The average migration distance or the bead model is 294 μm by day 7. (B) In this model, the beads are on top of the 3D fibrin construct, with an average migration distance of 325 μm and (C) shows the beads inside the 3D fibrin construct, and the cells inside the bead have to migrate between two layers of fibrin. This model showed the least migration of the three models, with an average distance of 256 μm. Arrows indicated the migrated cells.
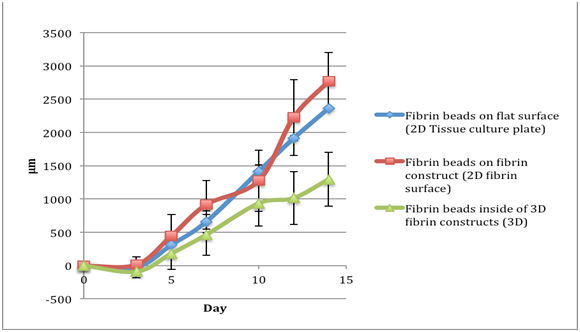
Figure 3 The comparison of migration of fibroblasts in fibrin beads of a fibrinogen 5 mg/ml, thrombin 5 IU/ml concentration. Data readings were taken for day 0, 3, 5, 7, 11, 13, and 15. By day 15, the cells reached the edge of the cell culture plate well. The y axis is Distance Migrated in micrometer.

Figure 4 The comparison of migration speeds of fibroblasts in fibrin beads of a fibrinogen 5 mg/ml, thrombin 5 IU/ml concentration. Data readings were taken for day 0, 3, 5, 7, 11, 13, and 15. The fibroblasts in beads on the 3D fibrin showed the largest migration speeds. The y axis is Distance Migrated in micrometer per day.

Figure 5 The migration of keratinocytes to outside the fibrin beads. (A) The migration of keratinocytes inside a fibrin bead on a cell culture plate. The average migration distance for the bead model on a cell culture plate is 334 μm by day 7. (B) In this model, the beads are on top of the 3D fibrin construct, with an average migration distance of 312 μm and (C) shows the beads inside the 3D fibrin construct, and the cells inside the bead have to migrate between two layers of fibrin. This model showed the least migration of the three models, with an average distance of 243 μm.
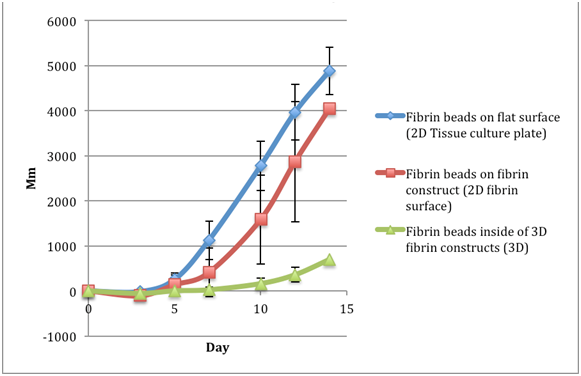
Figure 6 The comparison of migration of keratinocytes in fibrin beads of a fibrinogen 5 mg/ml, thrombin 5 IU/ml concentration. Data readings were taken for day 0, 3, 5, 7, 11, 13, and 15. The keratinocytes in beads on the cell culture plate migrated the most rapidly. By day 15, the keratinocytes were at the edge of the bead. The y axis is Distance Migrated in micrometer.

Figure 7 The comparison of migration speeds of keratinocytes in fibrin beads of a fibrinogen 5 mg/ml, thrombin 5 IU/ml concentration. Data readings were taken for day 0, 3, 5, 7, 11, 13, and 15. The fibroblasts in beads on the cell culture plate showed the largest migration speeds. The y axis is Distance Migrated in micrometer per day.
Statistical analysis
Data in this paper is presented as the mean ± standard error, with n=9 (triplicate constructs per condition, repeated three times). Two-tailed student’s t-tests were performed to determine if there was a significant difference in average migration of cells on the well plate surface, two-dimensional fibrin surface, and three-dimensional fibrin construct. The t-values and p-values are presented in Table 5.
Fibroblasts
Proliferation
Fibroblast proliferation is greatest in fibrin beads placed on culture dishes
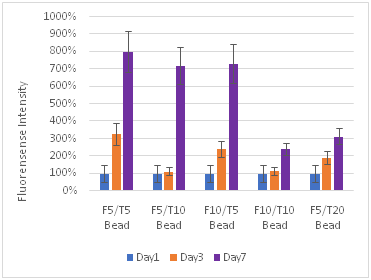
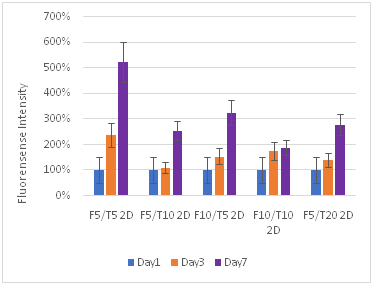
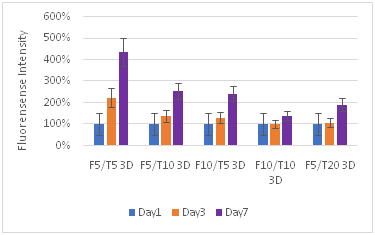
Fibroblasts proliferated most rapidly in fibrin beads seeded on culture plate than on any other surface, as shown in Figure 7 & 9. By day 7, fibroblasts proliferated approximately 2.5 times as much than cells in fibrin beads seeded on 3D fibrin construct, and about 3 times more than fibroblasts in fibrin beads seeded inside 3D fibrin constructs. The fibroblasts in fibrin beads proliferated the most on 3D fibrin constructs that was prepared with an initial concertation of fibrinogen 5ug/mL and thrombin 5ug/mL.
Increasing the thrombin concentration in the 2D fibrin constructs has more effect on the proliferation than increasing fibrinogen concentration. Doubling the thrombin concentration from 10 IU/mL to 20 IU/mL decreased the proliferation rate by 2.5 by day 7. Increasing the fibrinogen concentration while keeping the thrombin concentration constant decreased the proliferation rate at day 3. However, by day 7 the overall proliferation rate compared to day 1 was the same as the lower fibrinogen concentration (Figure 7 & 9). It seems that while the increase in fibrinogen concentrations initially leads to slower cell growth, as the bead degrades the cells are still able to proliferate to a high level.
In addition, high concentrations impede cell growth. The high concentrations of fibrinogen 10 mg/mL and thrombin 20 IU/mL had a small increase in proliferation by day 7 but did not exhibit high proliferation values. While the fibrinogen concentration did not have a large effect on proliferation, the increasing thrombin concentration slowed the proliferation rate of fibroblasts.
Migration
Fibroblasts migrate fastest on cell culture plates: Significance was determined using an α level of 0.05. From the Table 5, it can be concluded that there is a significant difference in fibroblast migration on each of the three surfaces. Keratinocytes, however, do not have a significant difference in migration inside the 3D fibrin constructs compared to beads on the 3D fibrin construct or the well plate surface. We first examined the cells migrating out of the beads; the distance of the cells from the periphery of the was measured as described in the materials and methods. Figure 2–4 shows that fibroblasts on culture dishes migrate out of the bead on day 5 while fibroblasts on 3D fibrin constructs and inside 3D fibrin constructs started migrating out on day 3. Fibroblasts on culture dishes showed a continually increasing rate of migration and total migration distance. From the Table 5, it can be concluded that there is a significant difference in fibroblast migration on each of the three surfaces.
Fibroblasts on 3D fibrin constructs have the overall highest rate of migration and total migration distance; however, there was a lag period in migration rate on day 7-10. Fibroblasts in fibrin beads inside 3D fibrin constructs resulted in the lowest rate of cell migration as well as the shortest total migration distance, and a lag period of migration rate was found from day 10-12. From Figure 6, we can see that the concentration of fibrinogen 5 mg/mL thrombin 5IU/mL resulted in the fastest and farthest movement overall compared to the other concentrations of fibrinogen used; cells on the 3D fibrin constructs migrated the fastest. The fibrinogen 5 thrombin 10 concentration on 3D fibrin surface had the second fastest migration rate. The third fastest was fibrinogen 5mg/mL thrombin 5 IU/mL on the cell culture plate. In this case, the surface of the beads was more important than the concentration, implying the importance of the surface.
Fibroblasts on cell culture plates showed mostly constant rates of migration after day 5: Monitoring the pattern of fibroblasts migration showed how the cells interacted with the culture dishes. After fibroblasts started to migrate out of the beads on day 5, the average rate of migration on the culture dishes seemed to be constant throughout the experiment from about day 5-14. The cell migration morphology after coming out of the bead showed a tortuous movement. The flattened cells clearly displayed the cell nuclei, giving excellent resolution for cell identification. The size of the bead did not observe any significant change in diameter throughout the 14 day period, and there was slightly degradation at the edges of the beads. The fibroblasts seemed to interact with the culture dishes in a way that accelerated their movement.
Fibroblasts in fibrin beads situated on 2d fibrin constructs showed a faster migration rate: The 2D fibrin constructs accommodated faster cells migration for the fibroblasts coming out of the fibrin beads. Fibroblasts began migrating out of the fibrin microbeads on day 3 (Figure 2 & 3). The rate of migration increased for the first 7 days. However, at day 7-10, the migration rate slowed down from 235.6 micrometers per day to 120.7 micrometers per day. After this lag period, the rate of migration at day10-12 started to increase again almost 4-fold compared to the previous migration rate. The cell migration paths were overall straight lines projecting radially outward from the bead. The size of the fibrin bead observed a significant change in diameter during the experimental period, and the average total decrease in diameter was 1.71 mm.
Fibroblasts in fibrin beads placed inside 3d fibrin constructs showed a decreased migration rate: Fibroblasts did not move as rapidly out of the fibrin beads that are placed inside 3D fibrin constructs. Fibroblasts migration out of the fibrin beads inside the 3D fibrin constructs began on day 3 (Figure 2–4). The rate of migration appeared consistent from day 3 to day 10 at about 150.5 micrometers per day. From day 10 to day 2, there was a drop in migration rate from 157.58 micrometers per day to 40.3 micrometers per day. The cell morphology after leaving the bead was similar to fibroblasts on 3D fibrin constructs and moved directly outward from the bead. The bead diameter also decreased by 1.6mm.
Keratinocytes
Proliferation
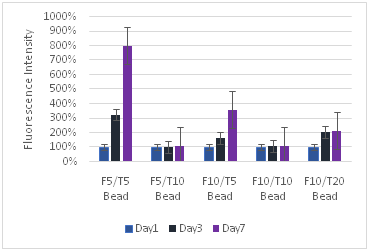
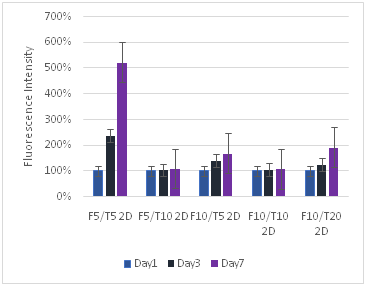
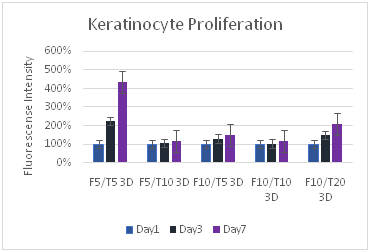
Keratinocyte proliferation was greatest for the fibrin 5 mg/ml and thrombin 5 iu/ml concentration: Keratinocytes proliferated most rapidly and the greatest amount at the F5T5 concentration, particularly on the plastic cell culture plate (Figure 8). The other concentrations exhibited much lower proliferation, at least four times lower than the F5T5. However, other concentrations showed larger amounts of proliferation for the cell culture surface than the F5T5 did for the cells inside and on 3D fibrin constructs. Like fibroblast proliferation, increasing the amount of fibrinogen did not have a large decrease in proliferation, but increasing the thrombin did. While by day 3 the change in proliferation was similar to the concentration of the construct with lower thrombin, by day 7 there was a noticeable difference in the proliferation that occurred. The keratinocytes proliferated 15% better with a concentration of F10T5 rather than F5T10, indicating that fibrin is more conducive to proliferation than thrombin.
(A)
(B)
(C)
Figure 8 Keratinocytes Cell Proliferation. F refers to the fibrin concentration in mg/ml and the T refers to the thrombin concentration in IU/ml. The bead models without any layers of fibrin showed the highest amount of proliferation for keratinocytes.
(A)
(B)
(C)
Figure 9 Cell Proliferation, F refers to the fibrin concentration in mg/ml and the T refers to the thrombin concentration in IU/ml. The bead models without any layers of fibrin showed the highest amount of proliferation for fibroblasts.
Fibroblasts proliferate more than keratinocytes: Fibroblasts proliferated at a greater rate than keratinocytes, and often ended with a larger number of cells in the well plate. While the maximum proliferation of fibroblasts was about 8 times the original reading and for keratinocytes the maximum was about 3 times, fibroblasts consistently had large proliferation rates with other concentrations, reaching close to the maximum 8 times amount, while for keratinocytes the proliferation dropped off sharply after the lower F5T5 concentrations. Both proliferated at greater rates on the plastic well plate, and also at lower concentrations. Beads by themselves had a greater rate of proliferation than their corresponding 2D or 3D constructs. Both cell types were strongly affected with increasing the thrombin concentration, while the fibrin concentration did not have as large of impact. While for keratinocytes the change from bead only, 2D construct, and 3D construct did not lead to a large decrease in proliferation rate between the constructs, for fibroblasts increasing the complexity of the matrix from bead to 2D construct leads to a 60% drop in proliferation. The difference between the 2D and 3D construct is a 25% drop. For keratinocytes, the drop is generally about only 10%.
Migration
Keratinocytes migrate fastest on culture plate with beads of fibrinogen 10 mg/ml and thrombin 5 iu/ml: Keratinocytes began to migrate out of the beads at day 5 for all models (Figure 5). Keratinocytes on the culture plate migrated fastest and furthest throughout the experiment. Keratinocytes on 3D fibrin constructs displayed similar migration rates to keratinocytes on 3D fibrin constructs but were slower and observed a migration lag period from day 5-7. Keratinocytes in 3D fibrin constructs had the slowest migration rate and shortest total migration distance compared to the other two models, and there was also a migration lag period from day 5-7.
Keratinocyte-fibrin beads on culture dishes provided the fastest migration rate: Migration tracking began on day 5 after cell integration (Figure 5). The rate of migration increased and reach the highest point at day 12, 595 micrometers per day, and decreased afterward to a rate of 459.2 micrometers per day. The keratinocytes displayed oval shape without actin fibers and analogous cell morphology inside and outside the bead. The cell nuclei were clearly observed, and the spaces between cells were narrow. The size of the bead as constant and only slightly decreased in diameter due to degradation on the border of the bead.
Keratinocyte-fibrin beads on 3d fibrin constructs showed low migration rates: Migration tracking began on day 5 after cell integration (Figure 5). The rate of migration increased during the first 5 days and remained relatively constant for two days afterward. After day 7-12, the rate of migration drastically increased. There is no change in the cell morphology inside and outside the bead, and the cells resemble keratinocytes on 2D flat surfaces. The size of the bead, on the other hand, shrunk over the time by 1.5 mm. However, the average rate of migration and total migration distance for this model was the slowest. There was a migration lag period from day 5-7 as rates decreased from 28.8 micrometers per day to 11.2 micrometers per day. On day 15, the diameter of the bead decreased by 1.3mm.
Keratinocytes migrate fastest with fibrinogen 10ug/ml and thrombin 5ug/ml: The comparison of migration for fibroblasts and keratinocytes are summarized in Table 1–7. The F10T5 (fibrinogen 10 mg/ml, thrombin 5 IU/ml) concentration proved to be most effective in both migrating the keratinocytes out the fastest as well as the farthest. The F5T5 on the cell culture plate was the second fastest, followed by the F10T5 for the 2D fibrin layer construct. The migration exhibited the same behavior of slowly moving out to the edge of the bead by day 3 and migrating more rapidly after exiting the bead. Doubling the thrombin concentration to 20 ug/mL severely restricts the migration rate as well to almost two times lower but doubling the fibrinogen concentration does not have as severe an affect.
Fibroblasts: Total migration distance for a fibrinogen 5 mg/ml, thrombin 5 IU/ml concentration |
|||||||
Day |
0 |
3(μm) |
5(μm) |
7(μm) |
10(μm) |
12(μm) |
14(μm) |
Fibrin beads on flat surface (2D Tissue culture plate) |
0 |
-27 |
308 |
656 |
1411 |
1910 |
2362 |
Fibrin beads on fibrin construct (2D fibrin surface) |
0 |
12 |
441 |
912 |
1275 |
2223 |
2770 |
Fibrin beads inside of 3D fibrin constructs (3D) |
0 |
-91 |
179 |
461 |
934 |
1014 |
1293 |
Table 1 The comparison of migration distances of fibroblasts in fibrin beads of a fibrinogen 5 mg/ml, thrombin 5 IU/ml concentration. Data readings were taken for day 0, 3, 5, 7, 11, 13, and 15. The negative numbers account for the shrinkage of the bead, which pulled the cells back
Fibroblasts: Rate of migration a fibrinogen 5 mg/ml, thrombin 5 IU/ml concentration |
|||||||
Day |
0 |
3(μm/day) |
5(μm/day) |
7(μm/day) |
10(μm/day) |
12(μm/day) |
14(μm/day) |
Fibrin beads on flat surface (2D Tissue culture plate) |
0 |
-9 |
167 |
174 |
251 |
249 |
225 |
Fibrin beads on fibrin construct (2D fibrin surface) |
0 |
4 |
214 |
235 |
120 |
474 |
273 |
Fibrin beads inside of 3D fibrin constructs (3D) |
0 |
-30 |
135 |
141 |
157 |
40 |
139 |
Table 2 The comparison of migration speeds of fibroblasts in fibrin beads of a fibrinogen 5 mg/ml, thrombin 5 IU/ml concentration. Data readings were taken for day 0, 3, 5, 7, 11, 13, and 15, and the distance was divided by the day to obtain the migration rates
Keratinocytes: Total migration distance of a fibrinogen 5 mg/ml, thrombin 5 IU/ml concentration |
|||||||
Day |
0 |
3(μm) |
5(μm) |
7(μm) |
10(μm) |
12(μm) |
14(μm) |
Fibrin beads on flat surface (2D Tissue culture plate) |
0 |
-10.929 |
255.215 |
1124.66 |
2774.26 |
3964.34 |
4882.73 |
Fibrin beads on fibrin construct (2D fibrin surface) |
0 |
-103.83 |
139.55 |
412.393 |
1585.17 |
2868.15 |
4046.45 |
Fibrin beads inside of 3D fibrin constructs (3D) |
0 |
-54.645 |
2.89048 |
25.3749 |
162.416 |
357.929 |
696.266 |
Table 3 The comparison of migration distances of keratinocytes in fibrin beads of a fibrinogen 5 mg/ml, thrombin 5 IU/ml concentration. Data readings were taken for day 0, 3, 5, 7, 11, 13, and 15
Rate of migration of keratinocytes for a fibrinogen 5 mg/ml, thrombin 5 IU/ml concentration |
|||||||
day |
0 |
3(μm/day) |
5(μm/day) |
7(μm/day) |
10(μm/day) |
12(μm/day) |
14(μm/day) |
Fibrin beads on flat surface (2D Tissue culture plate) |
0 |
-3.643 |
133.072 |
434.722 |
549.868 |
595.038 |
459.195 |
Fibrin beads on fibrin construct (2D fibrin surface) |
0 |
-34.608 |
121.688 |
136.421 |
390.927 |
641.487 |
589.151 |
Fibrin beads inside of 3D fibrin constructs (3D) |
0 |
-18.215 |
28.7676 |
11.2422 |
45.6804 |
97.7566 |
169.168 |
Table 4 The comparison of migration rates of keratinocytes in fibrin beads of a fibrinogen 5 mg/ml, thrombin 5 IU/ml concentration. Data readings were taken for day 0, 3, 5, 7, 11, 13, and 15
|
Fibroblasts |
Keratinocytes |
||||
|---|---|---|---|---|---|---|
Well plate/2D fibrin surface |
Well plate/3D fibrin construct |
2D fibrin surface/3D fibrin construct |
Well plate/2D fibrin surface |
Well plate/3D fibrin construct |
2D fibrin surface/3D fibrin construct |
|
t-value |
2.0555 |
2.0639 |
2.0687 |
2.0555 |
2.1448 |
2.1448 |
p-value |
0.522 |
0.8073 |
0.3563 |
0.5961 |
0.0135 |
0.0308 |
Significant? |
Yes |
Yes |
Yes |
Yes |
No |
No |
Table 5 Significance values for migration of fibroblasts and keratinocytes
Fibroblast Migration (um) |
|||
Day 3 |
Day 5 |
Day 7 |
|
F5T5 Bead |
210.32 |
335.63 |
611.9 |
F5T5 2D |
234.76 |
285.31 |
298.76 |
F5T5 3D |
189.34 |
241 |
420 |
F5T10 Bead |
201.23 |
250.34 |
397.95 |
F5T10 2D |
180.34 |
190.23 |
360.26 |
F5T10 3D |
123.45 |
130.23 |
200.34 |
F10T5 Bead |
217.64 |
250.34 |
379.64 |
F10T5 2D |
180.34 |
230.85 |
345.32 |
F10T5 3D |
141.09 |
210.34 |
270.12 |
F10T10 Bead |
88 |
134.63 |
283 |
F10T10 2D |
87 |
100.45 |
223.24 |
F10T10 3D |
53.07 |
92.34 |
197.12 |
F5T20 Bead |
227.14 |
400.61 |
477.3 |
F5T20 2D |
152.94 |
350.79 |
479.19 |
F5T20 3D |
75.43 |
298 |
321.88 |
Table 6 Migration distances of fibroblasts for all three models at different concentrations
Keratinocyte Migration (μm) |
|||
Column1 |
Day 3 |
Day 5 |
Day 7 |
F5T5 Bead |
238.83 |
333.58 |
407.94 |
F5T5 2D |
186.45 |
297.36 |
420 |
F5T5 3D |
177.85 |
273.98 |
376.64 |
F5T10 Bead |
201.23 |
250.34 |
397.95 |
F5T10 2D |
180.34 |
190.23 |
360.26 |
F5T10 3D |
123.45 |
130.23 |
200.34 |
F10T5 Bead |
227.14 |
400.61 |
479 |
F10T5 2D |
152.94 |
350.79 |
450 |
F10T5 3D |
75.43 |
298 |
321.88 |
F10T10 Bead |
127.14 |
187.34 |
234.84 |
F10T10 2D |
102.94 |
145.36 |
187.67 |
F10T10 3D |
75.43 |
86.98 |
100.75 |
F5T20 Bead |
127.14 |
207 |
403 |
F5T20 2D |
102.94 |
145.36 |
245 |
F5T20 3D |
75.43 |
86.98 |
126 |
Table 7 Migration distances of keratinocytes for all three models at different concentrations
In this study, we present a new method for fibrin microbead fabrication to be used in a novel wound healing model. We observed migration and proliferation of fibroblasts and keratinocytes in three different fibrin microbead microenvironments–culture dishes, on 3D fibrin surface, and inside 3D fibrin constructs – to assess the characteristics and viability of each cell type.
Fibroblasts
Proliferation of fibroblasts was greatest in fibrin beads on the tissue culture plate and least in the three-dimensional construct (Figure 5). Sporn et al. found that exposure to thrombin-cleaved peptides of fibrinogen stimulates cell proliferation 15, which implies that greater proliferation would occur in environments with more fibrin. It may be that the radial movement of fibroblasts in the fibrin matrix reduced cell signaling compared to the well plate since the cells can move farther apart in a three-dimensional environment. The reduced cell contact and signaling may have contributed to the reduction in cell proliferation.
The migration rate and migration distance of fibroblasts on culture dishes increased throughout the experiment (Figure 2–4). This migration result is similar to culturing fibroblasts to confluency on a plastic tissue culture plate.11 This proves that when the fibroblasts migrated out the fibrin microbeads, they still carried the same characteristics, such as integrins, since they were able to migrate through the empty space of the plastic well as usual. At day 12, fibroblasts reached a threshold confluency, and the migration rate dropped. This indicated that after migrating out of the fibrin microbeads, fibroblasts did not lose ability to communicate with each other via signaling pathways.12 The cell morphology was also similar to culture on plastic tissue culture surfaces. In addition, because the cells could not enter a third dimension such as on the 3D fibrin construct or inside the 3D fibrin construct, the cells choose to twist the direction.
The rate of fibroblast migration out of the bead on the 2D fibrin surface is the fastest among the three models. This indicates that fibroblasts are most comfortable migrating to a fibrin environment.13 However, the rate of migration fell during day 7 to day 10. This lag period of migration rate might be due to temporary contact inhibition signals released from the cells as a result of their actin fiber proximity.14
The rate of fibroblast migration out of the bead inside the 3D fibrin construct is the slowest among the three models. One possible explanation is that fibroblasts could migrate radially in all directions, and thus appeared to have a lower migration distance on the observed plane. Another reason for the slowed migration may be the reduced diffusion of nutrients. Because the fibrin microbeads are place in between two fibrin layers and the media is added on the top, the media may not be sufficiently diffusing through the bead to deliver nutrients and remove cell waste. The concentration of F5T5 was the best for most rapid migration and proliferation. Fibroblasts seem to thrive in environments of low concentration because they are more adept at traveling and proliferating when they do not have much resistance in their pathway. However, because they do travel more quickly and farther than keratinocytes and proliferated at higher rates with various concentrations compared to the keratinocytes which proliferated well with only F5T5, fibroblasts appear to be the cell type better able to adapt to their environment and degrade the fibrin matrix to allow for movement. While for best growth and movement fibroblasts should be placed environments with as little resistance as possible, they seem to be much better adapted to altering their environment than keratinocytes. Studies show that fibroblasts actually stimulate keratinocyte growth and migration with a correlation to a heparin-binding EGF-like growth factor found approximately three days after the coculture of fibroblasts and keratinocytes. The addition of fibroblasts to a keratinocyte culture increases the growth for the first five days, but the growth levels decrease and return to normal after this time.10 However, the addition of keratinocytes has no effect on the growth of fibroblasts. Fibroblasts can excrete many growth factors and environment-changing chemicals that stimulate growth and provide space for them to move.
Keratinocytes
Similar to the fibroblasts, the keratinocytes showed the highest rate of proliferation with the fibrin 5 ug/mL thrombin 5 IU/mL concentration. Although it was expected that the keratinocytes would proliferate the most efficiently at the concentration for the best migration, keratinocytes proliferated more rapidly in this more dilute concentration because F10T5 lead to a greater migration distance, minimizing cell-to-cell interactions and thus lowering proliferation rates. Keratinocytes proliferate best with high density, and because they are smaller cells than fibroblasts a greater density is needed than for the fibroblast model.
The rate of keratinocytes migration on the culture plate surface is the fastest among the three setups (Table 4). This is reasonable because keratinocytes migrate on top of the healthy granulation tissue, which is a firm high tensile tissue matrix16. The normal force exerted on the cells drives the migration forward.17 We can also infer that if the tensile strength of the granulation tissue increases, the keratinocytes might travel faster to close and heal the wound. However, if tensile strength is too high, excess collagen can cause scarring.18 The migration rate and total distance travelled on 3D fibrin constructs is higher than inside 3D fibrin constructs, and this indicates that the surrounding fibrin limits the movement of keratinocytes. Since the motile keratinocytes penetrate the fibrin matrix by forming cylindrical tunnels and helical tunnels,19 the increased fibrin matrix in 3D fibrin constructs slowed down the penetration process and decreased the average rate of migration. Thus, the amount of fibrin in the granulation tissues could affect the wound healing process because keratinocytes migrate underneath the blood clot to re-epithelialize the wound, and thus keratinocytes will not be able to migrate well in excess fibrin. Also, this penetration process causes the destruction of the matrix, and can be seen on the edge of the fibrin bead (Figure 5). Keratinocytes migrate the most rapidly with the F10T5 concentration. Increasing the amount of thrombin in the construct had negative effects on the both the migration and proliferation. Unlike fibroblasts, keratinocytes reacted well with an increased amount of fibrinogen, thriving in almost double the concentration. Studies have shown that fibrinogen and fibrin lead to less adhesive structures for keratinocytes. Increasing the concentration of fibrinogen let the keratinocytes more freely about the surface, explaining by a concentration of 10 ug/mL was more effective than 5 ug/mL. However, increasing the concentration of fibrinogen past 10 ug/mL lead a sharp decrease in migration and proliferation. Increasing the concentration by too much traps the keratinocytes in the constructs and inhibits the helpful behaviors of the fibrinogen, as the keratinocytes cannot migrate out more freely because of the high density of the fibrin gel.
The fibrin microbead
In all fibrin microbeads, since the concentration of fibrinogen and thrombin are not perfectly mixed together, portions of the fibrin microbeads had larger pores. Fibroblasts and keratinocytes migrated out of these areas of large porosity first due to the lower density of the fibrin matrix in these areas.7,9 Cells have the fastest motility in intermediate concentrations of ligand due to the optimum turnover of integrin-mediated adhesion;20 the lower density of fibrin fibers may correspond to this intermediate concentration.
The fibrin microbead surfaces on the 3D fibrin constructs and inside the 3D fibrin constructs showed that the size of the beads decreased throughout the experimental period. This could be due to frontal pulling on the bead from the cell migration out of the bead. As the integrins form and reform focal adhesions with the fibrin, the fibrin matrix is constantly remodeled and put under tension.20 Once more cells migrate completely out of the bead, this tension is released, causing the beads to shrink over time.
Fibrin microbeads are a viable tool to create microenvironments within three-dimensional constructs. The change in migration rate with respect to cell density and proliferation over time showed that fibroblasts and keratinocytes retained their ability to communicate with one another even after they left the fibrin bead. Keratinocytes and fibroblasts had the fastest migration rate on the cell culture plate and the slowest migration rate inside the 3D constructs. The lower migration rate inside the 3D construct can be explained by the movement of cells in all radial directions, which causes less total migration when compared to movement along the 2D plane. Fibroblasts proliferated and migrated the most with a concentration of fibrinogen 5ug/mL and thrombin 5 IU/mL, and keratinocytes migrated fasted with fibrinogen 10 ug/ml and thrombin 5 IU/mL. Keratinocytes also proliferated most quickly with fibrinogen 5 ug/ml, thrombin 5 IU/mL.
Due to inconsistencies in relative fibrin and thrombin concentration at various points on the fibrin bead, some areas were more porous than others; cells migrated more quickly out of these more porous areas. Further research can be done on the optimum fibrin and thrombin concentration to optimize cell migration and reduce inconsistencies in porosity. In addition, determining which growth factors are released at certain stages of the migration and proliferation will shed more light on the mechanism of how the cells degrade the fibrin and the factors they use to migrate and grow. Further research can also be done to determine the effectiveness of fibrin beads in more complex and realistic wound healing models. Fibrin beads containing fibroblasts or keratinocytes can be placed in a three-dimensional collagen matrix; the fibrin beads can also be loaded with growth factors to better simulate a skin wound. The behavior of cells in response to this more complex model will provide a platform to better understand the in vitro dynamics of wound healing.
None.
Author declares that there is no conflicts of interest.

©2018 Ganapa, et al. This is an open access article distributed under the terms of the, which permits unrestricted use, distribution, and build upon your work non-commercially.