Advances in
eISSN: 2373-6402


Research Article Volume 8 Issue 6
1Bangladesh Agriculture Research Institute (BARI), Gazipur
2International Potato Center (CIP), Bangladesh
Correspondence: Abdullah-Al-Mahmud, Potato Breeder, Tuber Crops Research Centre (TCRC), Bangladesh Agricultural Research Institute (BARI), Joydebpur, Gazipur, Bangladesh,, Tel +8801714046447
Received: October 30, 2018 | Published: December 26, 2018
Citation: Abdullah-Al-Mahmud, Hossain M, Akhter S, et al. Screening of CIP potato clones for salinity tolerance in pot and field condition. Adv Plants Agric Res.2018;8(6):573-580. DOI: 10.15406/apar.2018.08.00388
During the crop season 2013-14, five selected CIP bred potato clones along with 2 check varieties Diamant and Asterix were assessed in the lab against 6 different levels of NaCl salinity stress (T1=0 dS/m, T2=6 dS/m, T3=8dS/m, T4=10 dS/m, T5=12dS/m and T6=12dS/m) at Joydebpur, Gazipur and validation trials were conducted with the same CIP potato clones at Chittagong, Patuakhali and Satkhira for their suitability to saline areas. In pot trial, CIP-139 (CIP 396311.1) and CIP-102 (301029.18) showed better performance with lower yield reduction at 8 to 10 dS/m of NaCl salinity condition than other tested clones. Tolerant CIP clones accumulated more proline than the susceptible clones indicated the defense mechanism of the clones. At planting, the highest salinity level was recorded at Chittagong (6.00 dS/m) and the lowest was at Patuakhali (1.65 dS/m). During harvesting time, the highest level was recorded at Satkhira (10.81 dS/m) and the lowest was at Chittagong (8.70 dS/m). Mean highest yield was observed in CIP 139 (CIP 396311.1) (22.71 ton/ha) followed by CIP 102(301029.18) (19.84 ton/ha) and it was lowest in Diamant (15.85 ton/ha). Considering the stress susceptibility index, proline accumulation and yield performance in the three saline locations CIP-139 (CIP 396311.1) and CIP-102 (301029.18) were best suited for 10-12 dS/m2 of salinity with higher yield potential and could be recommended to release as saline tolerant potato variety/ies in Bangladesh.
Keyword: CIP clones, salinity susceptibility index, proline content and yield
Salinity is one of the most important environmental stresses which severely limit plant growth and productivity worldwide and the problem is ever accumulative. In Bangladesh, more than 1 million hectares of the coastal areas have been seriously affected by salinity which is considered as one of the major problems of crop production in the coastal areas of Bangladesh. The salinity level also varied with time and place. The cultivable areas in coastal districts are affected with varying degrees of soil salinity 3.63-27.67(dS/m).1 In the dry period the agricultural land use in these areas is very poor due to increasing salinity. A high level of soil salinity adversely affects plant growth and development,2 harshly reduced the photosynthesis rate, nitrogen3 and carbon metabolism.4 Salinity causes severe nutritional disorders in plants with the increasing Na+ levels.5 Such physiological changes resulted decrease in plant growth6 and consequently in crop yield. In south and south western parts of Bangladesh like Chittagong, Barisal and Khulna divisions low crop productivity in crops is the salinity and in such climatic conditions potato cultivation is decreasing due to the rising of salinity.
The aptitude of plants for tolerance and grow well in saline soil condition has a great significance in agriculture, which point out the salinity tolerances capacity of plant.7 A complete alleviation of salinity stress is impossible. The practical and economical approach is the development of salinity tolerant potato genotypes. Under such circumstances, there are plenty of scopes to find out genotypes that have inherent capability of producing relatively higher yield by withstanding in the moderate salinity conditions. In order to develop salinity tolerant potato variety the efforts were initiated in Bangladesh, in collaboration with the International Potato Center (CIP) and Tuber Crops Research Centre (TCRC) of BARI. Therefore, these research activities were undertaken with the following objectives, 1) evaluating potato clone’s tolerance to salinity stress in lab trial and ii) validate the yield performance of the CIP clones in the saline areas of Bangladesh for expanding potato production.
Plant materials
Two experiments were conducted with 5 selected clones [CIP-102 (301029.18), CIP 111 (380583.8), CIP 112 (380606.6), CIP 130 (393617.1) and CIP 139 (396311.1)] with two checks BARI Potato-7 (Diamant) and BARI Potato-25 (Asterix).
Experiment-1(Pot experiment) was conducted at Tuber Crops Research Centre, BARI, Joydebpur, Gazipur in pot following CRD with 3 replications and was continued from November 2013 to February 2014. Salinity was induced in the pots by using NaCl solution. CIP potato clones were tested in this experiment with 6 levels of NaCl solution T1=0 dS/m, T2=6 dS/m, T3=8 dS/m, T4=10 dS/m, T5=12 dS/m and T6=12 dS/m. Whole tuber of 28-40 mm size was planted in a pot. Tubers were planted on 26 November 2013. Treatments were levied at 20 days after planting (after complete emergence).
Experiment-2 (Field experiment) was conducted in the field at Satkhira, Patuakhali and Chittagong districts following RCBD with 3 replications. The tubers were planted on 25th November at Patia, Chittagong, 2nd December at Satkhira and 3rd December at Patuakhali in 3.0m x3.0m size. Plant spacing was 60cmx25cm. Fertilizers were applied @ 160-44-132-15 kg/ha of N, P, K and S, respectively. Full amount of P, K and S and 50% of N were applied as basal and the remaining amount of urea was top dressed at 35 days after planting. Salinity level of soil at the experimental fields was collected before planting and during different cropping stage by using EC meter. Meteorological data of all locations were presented in the Table 1.
|
Location |
Nov. 13 |
Dec. 13 |
Jan. 14 |
Feb. 14 |
Mar. 14 |
Apr. 14 |
|
|
Patia, Chittagong |
Max. (C) |
31.49 |
28.09 |
25.81 |
29.2 |
32.36 |
33.81 |
|
Min. (C) |
19.13 |
15.83 |
14.28 |
16.59 |
27.7 |
24.93 |
|
|
R.H. |
76.28 |
77.26 |
71.16 |
67.02 |
64.25 |
74.66 |
|
|
Rainfall (mm) |
0 |
0 |
0 |
1.42 |
0.73 |
0 |
|
|
Kuakata, Patuakhali |
Max. (C) |
30 |
28.63 |
26.04 |
28.84 |
32.83 |
35.31 |
|
Min. (C) |
18.64 |
15.28 |
12.63 |
15.61 |
20.76 |
25.71 |
|
|
R.H. |
96.07 |
95.97 |
97.24 |
96.32 |
91.59 |
94.37 |
|
|
Rainfall (mm) |
0 |
0 |
0 |
10.33 |
1 |
5.33 |
|
|
ARS, Satkhira |
Max. (C) |
29.59 |
26.34 |
23.7 |
27.21 |
30.85 |
29.59 |
|
Min. (C) |
17.88 |
14.55 |
12.66 |
15.28 |
18.19 |
17.88 |
|
|
R.H. |
80.21 |
87.26 |
87.16 |
89.43 |
91.65 |
94.66 |
|
|
Rainfall (mm) |
0 |
0 |
0 |
0 |
1.15 |
0 |
|
Table 1 Meteorological data during 2012-2013 crop season at Chittagong, Patuakhali and Satkhira location
In experiment 1, data were collected on plant height, tuber number per plant and yield per plant. From leaf sample proline content was estimated at 40 days after planting. Proline accumulation of 3rd young leaf from the top was estimated at 50 DAP in five potato genotypes under two different salinity levels. Proline content was determined following the ninhydrin method.8 Proline content was expressed on a fresh weight basis from the standard curve, using standard L-proline according to the method developed by Troll & Lindsley.8
Data analysis
The recorded data were analyzed statistically using the computer package Cropstat 7.2. Percent reduction in plant height, tuber number per plant and tuber weight per plant was calculated by using the following formula.
Stress susceptibility index (SSI) for yield per plant of each genotype was calculated as follows.9
Where,
Yws, mean yields of a given genotype in salinity stress; Yns, mean yields of a given genotype in non-stress conditions; DII, Stress intensity index
Experiment 1
Potato clones respond differently under different levels of salinity and plant characters were significantly influenced on it (Table 2-4).1 The results revealed that plant height was decreased with the increase of salinity. At 0 dS/m salinity level, plant heights ranged from 23.75-35.00 cm at 60 DAP (Table 2), where Asterix produced the tallest plant followed by Diamant & CIP-111and CIP-102 being the smallest. But at 16 dS/m of salinity level, plant height was ranged from 11.00-22.00 cm where, CIP-139 produced the smallest plant and CIP-111 produced the tallest plant. But the lowest reduction in plant height was observed in CIP-111(32.82%) followed by CIP-112 (37.11%) and the highest reduction in plant height was observed in Asterix (65.71%) followed by Diamant (60.15%). The plant height showed inverse and significant correlation (R2=-0.5687) with the salinity level after 30 days of salinity treatment (Figure 1). Higher the salinity levels and lower the plant heights indicated the adverse effects of salinity on plant growth and its physiological process under saline environment. Growth of higher plants in saline soil depends on the salt tolerance of the plants species. The reduction in plant height is a consequence of several physiological responses including modification of ion balance, water status, mineral nutrition, photosynthetic efficiency.10,11 Reduced plant height under salinity is also associated with reactive oxygen species.12 Our findings agree with previous studies which indicated the adverse effects of salinity on plant height.13‒15
|
Clones/Varieties |
Plant height (cm) |
|||||
|
0 dS/m |
6 dS/m |
8 dS/m |
10 dS/m |
12 dS/m |
16 dS/m |
|
|
CIP-102 (301029.18) |
23.75 |
22.5 |
18.25 |
16.5 |
15 |
13.50 (43.16) |
|
-5.26 |
-23.16 |
-30.53 |
-36.84 |
|||
|
CIP-111 (380583.8) |
32.75 |
32.5 |
32 |
25 |
22.5 |
22.00 (32.82) |
|
-0.76 |
-2.29 |
-23.66 |
-31.3 |
|||
|
CIP-112 (380606.6) |
24.25 |
23.75 |
21 |
19.5 |
16 |
15.25 |
|
-2.06 |
-13.4 |
-19.59 |
-34.02 |
-37.11 |
||
|
CIP-130 (393617.1) |
24 |
22.75 |
19.75 |
19.25 |
14 |
12 |
|
-5.21 |
-17.71 |
-19.79 |
-41.67 |
-50 |
||
|
CIP-139 (396311.1) |
23.25 |
21.5 |
19.75 |
15.75 |
13 |
11 |
|
-7.53 |
-15.05 |
-32.26 |
-44.09 |
-52.69 |
||
|
Diamant |
33.25 |
31.5 |
27 |
20.25 |
18.25 |
13.25 |
|
-5.26 |
-18.8 |
-39.1 |
-45.11 |
-60.15 |
||
|
Asterix |
35 |
30 |
22 |
17.25 |
15 |
12 |
|
-14.29 |
-37.14 |
-50.71 |
-57.14 |
-65.71 |
||
|
LSD 0.05 Clones(C) |
4.34 |
|||||
|
Salinity level (L) |
3.02 |
|||||
|
C x L |
10.44 |
|||||
Table 2 Interaction effect of NaCl levels and varieties on plant height of different varieties/clones after 30 days of salinity treatment
|
Clones/Varieties |
Tuber numbers per plant |
|||||
|
0 dS/m |
6 dS/m |
8 dS/m |
10 dS/m |
12 dS/m |
16 dS/m |
|
|
CIP-102 (301029.18) |
15 |
14.89 |
10.25 |
6.5 |
3.75 |
3.75 |
|
-0.73 |
-31.67 |
-56.67 |
-75 |
-75 |
||
|
CIP-111 (380583.8) |
21.25 |
15.25 |
11.75 |
9.75 |
9.5 |
8 |
|
-28.24 |
-44.71 |
-54.12 |
-55.29 |
-62.35 |
||
|
CIP-112 (380606.6) |
16 |
15.75 |
15.5 |
13.5 |
13.48 |
10 |
|
-1.56 |
-3.13 |
-15.63 |
-15.75 |
-37.5 |
||
|
CIP-130 (393617.1) |
17 |
13.25 |
8.5 |
6.75 |
6.25 |
5 |
|
-22.06 |
-50 |
-60.29 |
-63.24 |
-70.59 |
||
|
CIP-139 (396311.1) |
15.5 |
14 |
13.5 |
11.25 |
9.25 |
8 |
|
-9.68 |
-12.9 |
-27.42 |
-40.32 |
-48.39 |
||
|
Diamant |
11.5 |
11.5 |
9.25 |
8.5 |
8.25 |
8 |
|
-8.87 |
-19.57 |
-26.09 |
-28.26 |
-30.43 |
||
|
Asterix |
12.75 |
8 |
7.25 |
7 |
6 |
4.25 |
|
-37.25 |
-43.14 |
-45.1 |
-52.94 |
-66.67 |
||
|
LSD 0.05 Clones © |
0.62 |
|||||
|
Salinity level (L) |
0.57 |
|||||
|
C x L |
1.53 |
|||||
Table 3 Interaction effect of NaCl levels and varieties on tuber numbers per plant of different varieties/clones at harvest
|
Clones/Varieties |
Yield per plant (g) |
|||||
|
0 dS/m |
6 dS/m |
8 dS/m |
10 dS/m |
12 dS/m |
16 dS/m |
|
|
CIP-102 (301029.18) |
276 |
163.25 |
111.75 |
102 |
52.5 |
21 |
|
-40.85 |
-59.51 |
-63.04 |
-80.98 |
-92.39 |
||
|
CIP-111 (380583.8) |
182 |
136 |
108.5 |
49.5 |
14.25 |
|
|
324.25 |
-43.87 |
-58.06 |
-66.54 |
-84.73 |
-95.61 |
|
|
CIP-112 (380606.6) |
181 |
134.25 |
103.25 |
75.25 |
35.5 |
|
|
300 |
-39.67 |
-55.25 |
(65. 58) |
-74.92 |
-88.17 |
|
|
CIP-130 (393617.1) |
141.75 |
99.25 |
68.25 |
48.75 |
20.5 |
|
|
301.25 |
-52.95 |
-67.05 |
-77.34 |
-83.82 |
-93.2 |
|
|
CIP-139 (396311.1) |
210.25 |
164 |
126.25 |
87.25 |
48 |
|
|
332.25 |
-36.72 |
-50.64 |
-62 |
-73.74 |
-85.55 |
|
|
Diamant |
164.75 |
118.75 |
89.5 |
74 |
39 |
|
|
366.75 |
-55.08 |
-67.62 |
-75.6 |
-79.82 |
-89.37 |
|
|
Asterix |
144 |
89.5 |
57.5 |
27 |
17.25 |
|
|
281.5 |
-48.85 |
-68.21 |
-79.57 |
-90.41 |
-93.87 |
|
|
LSD 0.05 Clones © |
37.37 |
|||||
|
Salinity level (L) |
34.59 |
|||||
|
C x L |
81.54 |
|||||
Table 4 Interaction effect of NaCl levels and varieties on tuber yield per plant of different varieties/clones at harvest
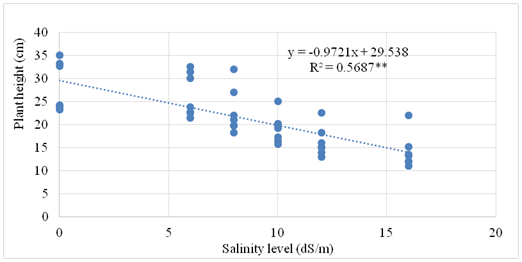
Figure 1 Correlation of plant height with salinity levels in potato genotypes grown in pot conditions.
(**indicates significance level at 1%. Data from plant height at different salinity levels after 30 days of salinity treatment used for establishing relationship).A decreasing trend was observed in tuber numbers per plant at higher salinity level in all tested potato clones. At 0 dS/m of salinity level all the clones produced the higher of tuber numbers per plant (11.50-21.25). CIP-111 produced the highest numbers of tuber per plant and Diamant being the lowest. With the increasing of salinity level (up to 16 dS/m) the tuber numbers per plant decreased gradually. Less than 50% (3.13-50.00%) of tuber reduction was observed at 8 dS/m of salinity level, but at 12 dS/m and 16 dS/m it was ranged from 15.75-75.00% and 30.43-75.00, respectively. Up to 10 dS/m the lowest reduction in tuber number was observed in CIP-112 (15.63%) and CIP-139 (27.42%), respectively and the highest was observed in CIP-102 (75%) (Table 3). The tuber yield per plant showed inverse and significant correlation (R2=-0.5513) with the salinity level at harvest (Figure 2). Higher the salinity levels and lower the tuber numbers per plant indicated the adverse effects of salinity on tuber setting under saline environment.
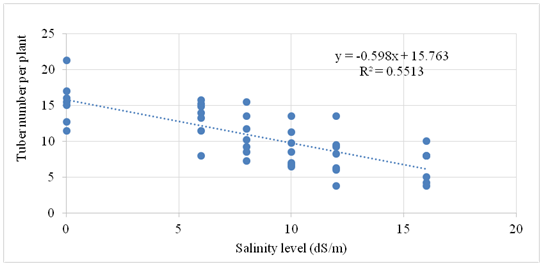
Figure 2 Correlation of tuber number per plant with salinity levels in potato genotypes grown in pot conditions. (**indicates significance level at 1%. Data from tuber number per plant at different salinity levels at harvest were used for establishing relationship).
Tuber yield is very sensitive to salinity conditions. Reduced yield per plant was obtained at higher levels of salinity compare to zero salinity level and gradual increased in reduction in yield was obtained with the increasing of salinity. The yield of potato clones was varied significantly among the treatment combinations. Tuber yield at 0 dS/m of salinity was ranged from 276.00-366.75 g whereas it was ranged from 14.25-48.00 g at 16 dS/m of salinity level (Table 4). Diamant (366.75 g) gave the highest yield followed by CIP-139 (332.25 g) and CIP-111 (324.25g) at 0 dS/m of salinity level. But in higher salinity condition they come up with yield reduction. Up to 8dS/m of salinity level, CIP-139 (50.64%), CIP-112 (55.25%), CIP-111 (58.06%) CIP-102 (59.51%) showed less than 60% of yield reduction. At high salinity level (16 dS/m), CIP-139 showed good tolerance with >85% yield reduction. The tuber yield per plant showed inverse and significant correlation (R2=-0.9045) with the salinity level at harvest (Figure 3). Higher the salinity levels and lower the tuber yield per plant indicated the adverse effects of salinity on tuber bulking and development under saline environment.
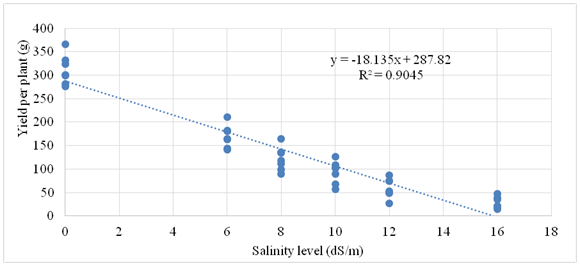
Figure 3 Correlation of tuber yield per plant with salinity levels in potato genotypes grown in pot conditions. (**indicates significance level at 1%. Data from tuber yield per plant at different salinity levels at harvest were used for establishing relationship).
Variation in proline accumulation was observed at 50 days after planting in seven potato genotypes under different levels of salinity condition (Table 5). Proline accumulation found higher at higher salinity level in all clones. At zero salinity level (0 dS/m), the highest proline accumulation was found in Asterix followed by CIP-130 and CIP-111 and the lowest was found in CIP-112 followed by Diamant. An increased trend was found for all clones with the increase of salinity levels. The highest accumulation of proline at 16 dS/m was found in CIP-111 followed by CIP-102, CIP-112, CIP-130 and CIP-139. The lowest proline accumulation was found in Asterix followed by Diamant. The proline content showed positive and significant correlation (R2=0.7161) with the salinity level after 20 days of salinity treatment (Figure 4). Increased proline accumulation under stress conditions were also observed by Farhad et al.;16 Mohamed et al.14 and Mahmud et al.17 Our findings showed accumulated more proline under salinity stress condition indicated the defense mechanism of the genotypes in the same stress condition. Proline, a non-protein amino acid formed in most tissues subjected to water/salinity stress, and together with soluble sugars, is readily metabolized following recovery from the stress condition.18 Proline also serves as a sink for energy to regulate redox potentials, a hydroxyl radical scavenger,19 a solute that protects macromolecules against denaturation and as a means for reducing acidity in the cell.20 Teixeira and Pereira21 indicated that high levels of proline enables the plant to maintain low water potentials causing the accumulation of compatible osmolytes that allows additional water to be taken up from the environment, thus buffering the immediate effect of water deficit within the organism.22 When salinity level increased in a soil, it makes soil water unavailable for the plant and plants appeared drought condition inside the cells of a plant. In this situation, plant accumulates proline in the plant parts like, leaves, stems, tubers etc. In general, the proline content of leaves increased with the decline in irrigation water, suggesting that the production of proline is probably a common response of potato under water stress condition. The role of proline in adaptation and survival of plants under drought stress were reported by Watanabe et al.23 and Saruhan et al.24
|
Clones/Varieties |
Proline content (µmol-1FW) |
|||||
|
0 dS/m |
6 dS/m |
8 dS/m |
10 dS/m |
12 dS/m |
16 dS/m |
|
|
CIP-102 (301029.18) |
0.72 |
7.44 |
8.5 |
7.79 |
12.86 |
56.62 |
|
CIP-111 (380583.8) |
1.05 |
2.69 |
6.55 |
15.09 |
16.71 |
57.89 |
|
CIP-112 (380606.6) |
0.62 |
4.37 |
8.51 |
10.35 |
20.45 |
49.62 |
|
CIP-130 (393617.1) |
1.06 |
12.36 |
20.62 |
25.32 |
37.58 |
47.2 |
|
CIP-139 (396311.1) |
0.81 |
10.41 |
12.73 |
13.77 |
21.81 |
44.4 |
|
Diamant |
0.66 |
3.4 |
10.05 |
12.01 |
27.47 |
36.92 |
|
Asterix |
1.17 |
12.76 |
12.63 |
18.9 |
19.9 |
28.5 |
|
LSD 0.05 Clones © |
1.28 |
|||||
|
Salinity level (L) |
1.18 |
|||||
|
C x L |
3.14 |
|||||
Table 5 Interaction effect of NaCl levels and varieties on proline content (µmol-1FW) of different varieties/clones at 60 DAP
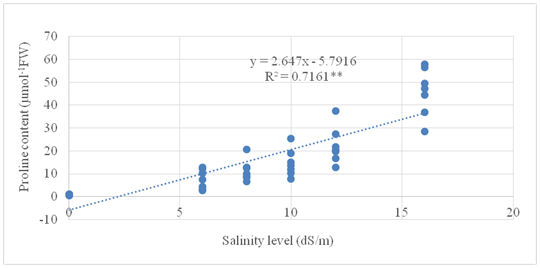
Figure 4 Correlation of proline content with salinity levels in potato genotypes grown in pot conditions. (**indicates significance level at 1%. Data from proline content at different salinity levels at harvest were used for establishing relationship).
Again, stress susceptibility index (SSI) was calculated for all the clones and presented in the same figure (Figure 5‒8). The DSI for tuber yield per plant was the lowest in CIP-139 was observed in 6-16 dS/m levels of salinity. So it indicated that CIP 139 was less susceptible in different levels of salinity. Another 2 clones CIP 102 and CIP 112 showed with comparatively low SSI as different levels of NaCl salinity. The highest SSI for yield per plant was found in Asterix, Diamant, CIP-130 and CIP-111 at lower to higher salinity level. Clones with high SSI were high yielder as well as very much sensitive to salinity. But, oppositely clones with low SSI were medium yielder and tolerant to salinity. So, potato clones CIP-139 and CIP-102 might be selected with comparatively low SSI and moderate to high yield for better productivity under salinity situation. Teran & Singh25 reported that resistant lines had relatively low SSI while the susceptible lines had high SSI values. Relatively low SSI were used in selecting of drought tolerant wheat genotypes were reported by Bazzaz et al. 2015.
Experiment-2 (Field experiment)
The level of soil salinity was measured in different stages of plant growth. During planting time salinity level was recorded 1.65, 3.46 and 6.0 dS/m at Patuakhali, Satkhira and Chittagong, respectively (Figure 9). During emergence period the levels of the salinity little increased than planting time. The salinity levels in all three locations were gradually increased with time and every stage of growth (Figure 10). At harvest, the salinity levels were 8.70 dS/m, 9.58dS/m and 10 dS/m in Chittagong, Patuakhali and Satkhira, respectively. Comparatively higher level of salinity was recorded at Patia, Chittagong and it was the lowest in Patuakhali at planting time. Again, at harvest higher salinity was recorded in Satkhira and lowest in Chittagong.
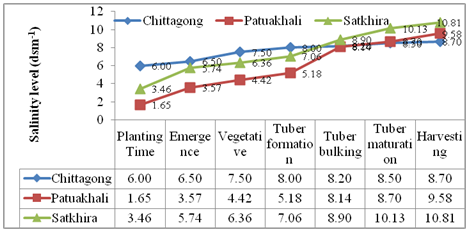
Figure 10 Salinity level of salt tolerance trial during different growth to harvest stage of potato at Chittagong, Patuakhali & Satkhira during 2013-14 crop seasons.
At 30 days after planting, the emergence percent ranged from 71.30-86.67 where the mean highest was observed in CIP-139 (86.67%) followed by Check variety Diamant (84.07%) and CIP-102 (82.97%). CIP-111(71.48%) and CIP-130 (71.30%) showed less than 80% mean emergence (Table 6 & 7). Considering the locations, at Patuakhali all clones exhibited with more than 90% of emergence at 30 days after planting except CIP-130. But, at rest of the two locations, less emergence in all clones observed, it might be due to higher salinity level during emergence period (Figure 1).
|
Clones/Varieties |
Emergence % at 30 DAP |
|||
|
Chittagong |
Patuakhali |
Satkhira |
Mean |
|
|
CIP-102 (301029.18) |
77.78 |
98.89 |
72.23 |
82.97 |
|
CIP-111 (380583.8) |
64.45 |
100 |
50 |
71.48 |
|
CIP-112 (380606.6) |
78.33 |
100 |
66.7 |
81.68 |
|
CIP-130 (393617.1) |
81.11 |
77.22 |
55.57 |
71.3 |
|
CIP-139 (396311.1) |
87.78 |
100 |
72.23 |
86.67 |
|
Diamant |
80.55 |
99.44 |
72.23 |
84.07 |
|
Asterix |
77.22 |
99.44 |
66.7 |
81.12 |
|
CV (%) |
8 |
|||
|
Lsd at (0.05) |
6.27 |
|||
Table 6 Salinity effect on emergence (%) of potato clones at 3 locations in Bangladesh during 2013-14 crop seasons
|
Clone/Variety |
Yield (ton/ha) |
|||
|
Chittagong |
Patuakhali |
Satkhira |
Mean |
|
|
CIP-102 (301029.18) |
12.53 |
29.72 |
17.27 |
19.84 |
|
CIP-111 (380583.8) |
13.11 |
24.19 |
16.22 |
17.84 |
|
CIP-112 (380606.6) |
12.63 |
25.98 |
16.27 |
18.29 |
|
CIP-130 (393617.1) |
14.41 |
18.33 |
16.26 |
16.33 |
|
CIP-139 (396311.1) |
19.6 |
28.88 |
19.66 |
22.71 |
|
Diamant |
13.16 |
20.97 |
12.74 |
15.62 |
|
Asterix |
12.71 |
21.85 |
12.98 |
15.85 |
|
CV (%) |
9.7 |
|||
|
Lsd at (0.05) |
2.91 |
|||
Table 7 Salinity effects on marketable yield per plot and yield of potato clones at 3 locations of Bangladesh during 2013-14
Salinity stress effects on plant growth & development and reduced yield adversely. In our study, all the clones showed higher reduction rate in plant characters in increased salinity level. In pot condition, 2 CIP clones namely CIP-139 (CIP 396311.1) and CIP-102 (CIP 301029.18) stands with less reduction in yield per plant at moderate salinity level. Higher proline accumulations were noticed in all CIP clones with the increasing of the salinity level. But, less accumulation of proline at higher salinity level were noticed in check Diamant and Asterix. Under different levels of NaCl salinity stress, tolerant clones exhibited with lower SSI and the susceptible clones exhibited with higher SSI. Among the 5 tested clones, CIP-139 (CIP 396311.1) performed well at all 3 locations. Among the locations, all the clones with 2 check variety gave the highest yield at Patuakhali, where the highest yield was observed in CIP-102 (CIP 301029.18) followed by CIP-139 (CIP 396311.1). But at Chittagong and Satkhira, CIP-139 (CIP 396311.1) produced the highest yield. Considering the mean yield over the locations, CIP-139 (CIP 396311.1) ranks 1st followed by CIP-102 (CIP 301029.18). According to the finding of the present study, these 2 clones were found suitable to cultivate 10-12 dS/m of salinity and could be recommended for large scale field trial in the saline districts.
Appreciation is extended to Director General of Bangladesh Agricultural Research Institute for giving the field and lab facilities for this study.
Author declares that there is none of the conflicts.

©2018 Abdullah-Al-Mahmud,, et al. This is an open access article distributed under the terms of the, which permits unrestricted use, distribution, and build upon your work non-commercially.