Advances in
eISSN: 2373-6402


Research Article Volume 9 Issue 3
Department of Crop Soil and Pest Management, Federal University of Technology, Nigeria
Correspondence: Akinlolu O OHUNAKIN, Department of Crop Soil and Pest Management, Federal University of Technology, Akure, Ondo State, Nigeria
Received: November 28, 2019 | Published: December 17, 2019
Citation: OHUNAKIN AO, Odiyi AC, Akinyele BO. Comparison of rank sum and Area under Disease Progress Curve (AUDPC) as determinant for relative resistance status of maize populations to Northern leaf blight disease of maize. Adv Plants Agric Res. 2019;9(3):395-400. DOI: 10.15406/apar.2019.09.00455
Thirty maize inbred lines obtained from International Institute of Tropical Agriculture (IITA), Ibadan were subjected to a cycle of inbreeding at Teaching and Research Farm of the Federal University of Technology, Akure (T&RF, FUTA). The genotypes were evaluated for their relative resistance to Northern leaf blight disease (NLBD) under screen house condition. The genotypes were exposed to infection under artificial disease infection pattern: disease incidence (DI) and index of symptoms severity (ISS) were assessed. Rank-sum (i.e., sum of ranks for DI and ISS for each population) and the Area Under Disease Progress Curve (AUDPC) were used to assess the relative resistance of the maize genotypes. Those that revealed low Rank-sum and AUDPC values were rated “moderately resistant (MR)’, “resistant (R)” and “highly resistant (HR)”, ‘‘moderately susceptible (MS)’’, ‘‘susceptible (S)’’, ‘‘highly susceptible (HS)’’to NLBD based on their respective values and deviation from the mean distribution curve. For Rank-sum method only population TZEI 1271 was rated HR with a deviation from grand mean distribution of -2.48, but rated MR under AUDPC with a deviation value -0.6 while none of the population rated HR for AUDPC method. Only population TZEEI 37 was rated HS with a mean deviation value of 2.52 for Rank-sum, but rated MS with deviation mean value of 0.05 under AUDPC method, while none of the genotypes revealed HS for AUDPC. Rank-sum method is a bit cumbersome but gave a precise and accurate results compared to AUDPC method. None of the genotypes was observed to be immune to the disease.
Keywords: Rank Sum, Area Under Disease Progress Curve, Northern leaf Blight, Index of symptoms severity, resistance, susceptible
Maize (Zea mays L.) has been reported as the most important cereal crop in Sub-Saharan Africa (SSA) and third most important cereal globally after wheat and rice. In Sub-Saharan Africa, maize is a staple food for an estimated 50% of the population with current production estimated at 10 million tonnes and average yield of 1.5 tonnes/ha. Maize is used directly for human consumption in SSA where it is processed on a small scale. Maize has wide genetic variability with ability to thrive successfully in diverse environments. In SSA, constraints to maize productivity includes, unpredictable rainfall pattern, low soil fertility, absence of improved technology and subsistence farming. The influence of several insect pests, diseases and infestation by parasitic weeds pose serious biotic stress on maize yield.1 Furthermore, recurrent drought is the principal climatic threat to maize productivity in SSA. Maize yield loss attributed to drought is about 15% annually.1 While, 45-60% yield loss was reported when drought occurred at flowering.1 In addition, maize yield loss due to disease infection is estimated at 24 million tons annually.2 Diseases could be devastating if they occur at juvenile, flowering and pollination stages,3 and they have gained more prominence as a production barrier due to climate change and global warming. Increased humidity and unpredicted high rainfall patterns have grave implications on expression of disease and pathogen population dynamics.
Maize yield per unit area is threatened by several pathogens viz; bacteria, nematodes, viruses and fungi. However, Northern leaf blight disease (NLBD) induced by fungus Exserohilum turcicum (Pass.) Leonard and Suggs (syn. Heliminthosporium turcicum Pass.) is an important and among the most widespread foliar disease worldwide.4 It poses a serious threat to maize production in maize growing region of Africa. The disease is most severe and destructive when extended periods of high relative humidity occur, with ability to cause severe defoliation during grain-filling stage.2 Documented yield losses of maize attributed to NLB vary from 16 to 69%,5 with estimated losses as high as 100% when severe epidemics contributed to loss of photosynthetic area, increased stalk lodging and eventual premature plant death. Symptoms presented by the disease include; greyish cigar shaped spots on affected leaves, water soaked lesions and scorched appearances on heavily infected maize.4 Symptoms of the disease are mainly influenced by host-pathogen interactions, pathogen strain, maize genotype, plant age at infection, and climatic conditions.4 Genetic resistance seems to be the best means to reduce yield loss from NLB in Africa, especially small-scale farmers that lack the financial capacity to chemical means of controlling the disease in maize.6 The improvement of quantitative traits to Northern leaf blight disease can contribute to stabilize maize productivity in vulnerable regions. However, differential symptom expression has been observed in developed varieties, thus suggesting genetic variation to disease resistance.7 In maize crop, genotypes were evaluated by exposing batches of inbred lines to maize streak disease infection and recording the number of days before each plant expressed symptoms, and also taken account of both incidence of the disease and symptoms severity.8
Burdon JJ9 reported three types of models for disease assessment viz; Critical-point model which provides an estimates of yield loss incurred for any given level of disease at a given time; Multiple-point model estimates losses from a disease progress curve that consists of many separate assessment points; and intermediate model, which relates yield reductions to the cumulative area under the disease progress curve (AUDPC). Critical-point model is based on the assumption that all disease curves reaching the same level of severity at the same time will cause the same yield loss, which is not the case most time, and therefore render the model a poor predicator.9 AUDPC models avoid this weakness and incorporate the effects of variations in both duration and severity of disease epidemics. The second model is not appropriate in a situation where relatively little is known about the physiological response of the host to the disease. AUDPC models require no prior knowledge. Moreover, in many occasions, AUDPC models have shown very close correlation between the cumulative level of disease and the resultant disease loss.4,10,11 Goktepe12 also indicated AUDPC as one of the means of quantifying host resistance.
Enlarged Rank-sum a non-parametric statistical method has been employed by different researchers as a means of determining different aspects of yield stability in crop, and also to group crop to different disease class based on their responses to disease infection. Mba REC13 reported rank-sum as effective means of measuring different aspects of yield stability in cassava.13 Badu3 employed rank-sum to determine the relative resistance of some cassava lines to African Cassava Mosaic Disease (ACMD). Therefore, this study aims to determine the relative resistance of 30 maize inbred lines to Northern leaf blight disease (NLBD) as well as comparing AUDPC and Rank-sum methods as a means of disease response determinant.
Thirty maize genotypes were obtained from International Institute of Tropical Agriculture (IITA), Ibadan. The genotypes were selected based on their flowering date and yield response. These genotypes were selfed pollinated twice at T&RF, FUTA. FUTA is located to the south of Akure at latitude 7°15lN of the equator and longitude 50 151E Greenwich meridian and 370 m above sea level. The mean annual rainfall varies from 1150mm to 2550mm and spread between April and October after which there is usually a 5month period of dry weather. The minimum temperature is 22°C and the maximum stands at 34°C.
The E.turcicum inoculum was isolated from diseased maize leaf with typical symptoms of northern leaf blight disease. The leaf was excised and surface sterilized using sequential washes of ethyl alcohol (950 ml/ L) for 15 s, sodium hypochlorite solution (100 ml/ L) for 3 min, and finally with ethyl alcohol (950 ml/ L) for 15s and blotted dry prior to placing on petri dishes containing 20ml Potato Dextrose Agar (PDA) (Merck KGaA, Darmstadt, Germany) amended with streptomycin. The petri dishes containing PDA were incubated at 22+2°C until the entire dish containing PDA was filled up with E.turcicum isolate.14,15. The pure culture of E. turcicum was maintained in PDA slants and stored in refrigerator until needed. Seven day old conidia were harvested by adding 5 ml of sterile distilled water (pH 7.5) per petri dish and gently scraping the surface. Spore concentrations were counted using a haemocytometer and adjusted to the desired concentration.16
The genotypes were screened for their relative resistance to northern leaf blight under screen house condition in June, 2015, at the T&RF, FUTA. Each genotype was planted in a polythene bag using Randomized Complete Block Design (RCBD) with three replications. At one week after planting (1WAP) (2 to 3 leaf stage), seven day old harvested conidia with a spore concentration of 106 SFU/ml was used to inoculate test plants using hand held sprayer. Inoculation was done towards evening and each test plant was covered with transparent polythene bag after inoculation to ensure proper spore infectivity. The polythene bags were removed very early the following morning. Disease Incidence (DI) was evaluated visually and was scored per plant at one week after inoculation (1WAI) for disease incidence. The Incidence per plant was calculated using this method;
Index of Symptom Severity (ISS) was assessed on all maize plants for each genotype for 7 weeks on weekly basis starting from 2 weeks after inoculation (2WAI). Scores were taken on all leaves on each plant in five classes of symptom severity rating with class five showing the most severe symptom following the procedure below. ISS for each plant was calculated following the method of Fauquet.9
Means were calculated for DI and ISS for each genotype at the end of the observation and ranked in descending order. For each rank position in each line, DI and ISS ranks were added together and grand mean of the rank position (X) for all the lines were calculated. Deviations from this rank score grand mean (Xn– X) was calculated for each line. The area under disease progress curve (AUDPC), the disease index (Din), the product of DI and ISS for each line was calculated. The AUDPC was calculated for each line in seven successive evaluations (i.e.weekly for 7 weeks) using the formula below,
where:
The AUDPC estimates were arranged in descending order and then assigned a rank score. Deviation of rank score was computed as the deviation of each rank score from the grand mean of the rank scores. Standardized Deviation (SD) was the product of deviation and a constant (0.2). Genotypes were categorized into various groups based on the SD values.18 Standardized deviation values falling to the right (positive) of the grand mean on the mean distribution curve were considered to be moderately susceptible, susceptible or highly susceptible while those falling to the left (negative) of the grand mean were placed in the moderately resistant, resistant or highly resistant category as shown below (Figure 1). A genotype was considered highly resistant to maize streak disease if its SD value was less than -2 from the grand mean, resistant if it was between -2 and -1, moderately resistant if was within -1 and 0, moderately susceptible if it was found between 0 and 1, susceptible if it fell between 1 and 2, and highly susceptible when it was > 2.8
Typical blighting symptoms of infection were observed beginning from five days post-inoculation. The symptoms began from the lowest leaf among the plants. The blights appeared as small scattered cigar shaped spots on inoculated leaves, greyish and water soaked lesions. The blights progresses to other leaves as the plants grow. These were observed virtually on all the leaves of the inoculated plants. At one week after inoculation (WAI) 100 % disease infection (DI) was observed irrespective of the genotype. As shown in Table 1, highest DI values were recorded for genotypes TZEEI 37 (80), TZEI 160 (80) and TZEI 9 (80) with lower ISS values 2.1, 2.3 and 2.2 than the ISS values recorded for TZEEI9 (2.8), TZEI 82 (3.5) and TZEEI 1304 (3) respectively. Genotypes TZEEI 9, TZEEI 82, TZEI 1303, TZEI 1247, TZEEI 8, TZEEI 1 and TZEI 10 recorded a DI value ranges between 60 and 70% while the remaining maize genotypes revealed 30-50% DI range as shown in Table 1. Genotypes TZEI 1271, TZEI 14, and TZEEI 55 had the lowest DI value (20%).
Genotype |
DI |
ISS |
RS |
Dev |
SD |
Class |
TZEEI 37 |
80(30) |
2.1(32) |
62 |
12.6 |
2.52 |
HS |
TZEEI 9 |
70(29) |
2.8(28) |
57 |
7.6 |
1.52 |
S |
TZEI 82 |
50(27) |
3.5(30) |
57 |
7.6 |
1.52 |
S |
TZEI 161 |
80(30) |
2.3(26) |
56 |
5.6 |
1.12 |
S |
TZEI 1304 |
40(26) |
3(29) |
55 |
5.6 |
1.12 |
S |
TZEI 9 |
80(30) |
2.2(25) |
55 |
5.6 |
1.12 |
MS |
TZEEI 82 |
60(28) |
2.3(26) |
54 |
4.6 |
0.92 |
MS |
TZEI 1315 |
50(27) |
2.5(27) |
54 |
4.6 |
0.92 |
MS |
TZEI 1303 |
60(28) |
2.2(25) |
53 |
3.6 |
0.72 |
MS |
TZEI 17 |
50(27) |
2.3(26) |
53 |
3.6 |
0.72 |
MS |
TZEI 1247 |
60(28) |
2(23) |
51 |
1.6 |
0.32 |
MS |
TZEEI 8 |
70(29) |
1.7(21) |
50 |
0.6 |
0.12 |
MS |
TZEI 1318 |
50(27) |
2(23) |
50 |
0.6 |
0.12 |
MS |
TZEEI 29 |
40(26) |
2.1(24) |
50 |
0.6 |
0.12 |
MS |
TZEI 27 |
30(25) |
2.2(25) |
50 |
0.6 |
0.12 |
MS |
TZEEI 55 |
20(24) |
2.3(26) |
50 |
0.6 |
0.12 |
MS |
TZEEI 8 |
70(29) |
1.7(21) |
50 |
0.6 |
0.12 |
MS |
TZEEI 1 |
70(29) |
1.6(20) |
49 |
-0.4 |
-0.08 |
MR |
TZEI 1305 |
30(25) |
1.9(22) |
47 |
-2.4 |
-0.48 |
MR |
TZEI 65 |
40(26) |
1.7(21) |
47 |
-2.4 |
-0.48 |
MR |
TZEI 35 |
50(27) |
1.6(20) |
47 |
-2.4 |
-0.48 |
MR |
TZEEI 6 |
30(25) |
1.7(21) |
46 |
-3.4 |
-0.68 |
MR |
TZEEI 21 |
50(27) |
1.4(18) |
45 |
-4.4 |
-0.88 |
MR |
TZEI 10 |
70(29) |
1.1(16) |
45 |
-4.4 |
-0.88 |
MR |
TZEI 187 |
40(26) |
1.4(18) |
44 |
-5.4 |
-1.08 |
R |
TZEEI 108 |
50(27) |
1.2(17) |
44 |
-5.4 |
-1.08 |
R |
TZEI 14 |
20(24) |
1.5(19) |
43 |
-6.4 |
-1.28 |
R |
TZEI 1250 |
40(26) |
1(15) |
41 |
-8.4 |
-1.68 |
R |
TZEI 1312 |
40(26) |
0.8(14) |
40 |
-9.4 |
-1.88 |
R |
TZEI 1271 |
20(24) |
0.5(13) |
37 |
-12.4 |
-2.48 |
HR |
Table 1 Relative resistance of some maize genotypes to NLB disease as determined by Rank-sum
Where: DI, Mean disease incidence and rank scores; ISS, Mean index of symptom severity and rank scores; RS, Rank-sum (i.e, Addition of the rank scores of DI & ISS); dev, Deviation from the grand mean of the Rank-sum and resistance category; SD, product of deviation and constant (0.2).
Furthermore, variations in ISS values among the genotypes followed a fluctuating pattern with genotypes which showed highest DI (80) had a lower ISS values (2.3, 2.2 and 2.1) (Table 1) compared with the genotypes that revealed highest ISS (3.5, 3, and 2.8) respectively with lower DI values (Table 1). The genotype that had the lowest DI (20) value still exhibited the lowest ISS (0.5) value among the evaluated genotypes.
A distinct difference (0.3) was observed between ISS values of genotypes TZEI 10 and TZEI 187 with attendant reasonable difference between their percentage means (Table 1). Also a clear cut difference was also recorded for ISS values between genotype TZEEI 37 and TZEI 82 with a distinct difference in their DI values (30%).Genotypes TZEEI 37, TZEI 161 and TZEI 9 had the same values for their DI with a slight difference in their ISS values (Table 1).
On the other hand, genotype TZEEI 82 showed the highest AUDPC (15.75) while the lowest value was recorded in genotype TZEI 1271 (5). A significant difference was recorded for the AUDPCs of genotypes TZEEI 82 and TZEEI 37 as well as between genotype TZEEI 82, TZEI 9 and TZEI 161 (Table 1).
Remarkable differences were shown in the disease index (DIn) fluctuation among the genotypes sampled on a weekly basis for each maize genotype. Genotype TZEI 1303 showed the highest index values at 7WAP (Figure 2a-2d), followed by genotype TZEEI 1 (Figure 2e-2g), while the lowest disease index value at 7 WAP was revealed by genotype TZEI 1271 (Figure 2h).

Figure 2a Northern leaf blight disease Progression for TZEI for TZEEI 1303 maize line between 2 and 7 weeks after planting.
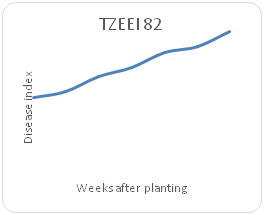
Figure 2b Northern leaf blight disease Progression 82 maize lines between 2 and 7 weeks after planting.
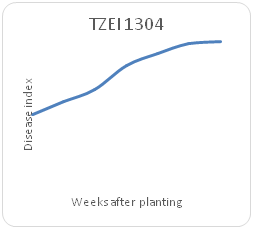
Figure 2c Northern leaf blight disease Progression for TZEI for TZEI 1303 maize line between 2 and 7 weeks after planting.
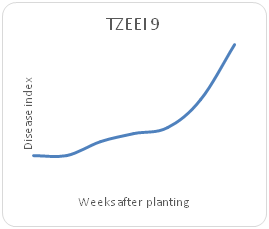
Figure 2d Northern leaf blight disease Progression TZEEI 9 maize line Between 2 and 7 weeks after planting.
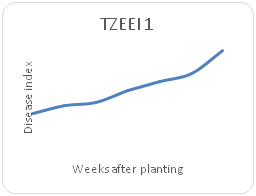
Figure 2e Northern leaf blight disease Progression for TZEEI for TZEI 1 maize line between 2 and 7 weeks after planting.
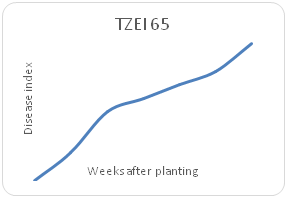
Figure 2f Northern leaf blight disease Progression 65 maize line between 2 and 7 weeks after planting.
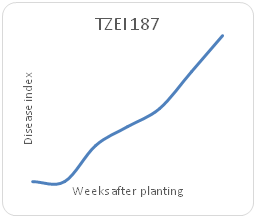
Figure 2g Northern leaf blight disease Progression for TZEI for TZEI 187 maize line between 2 and 7 weeks after planting.
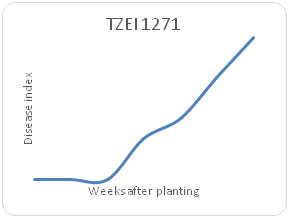
Figure 2h Northern leaf blight disease Progression 1271 maize line between 2 and 7 weeks after planting.
With Rank-sum method, the rank position in genotype TZEEI 37 had the highest deviation to the right of the grand mean of the rank position (+2.52) (Table 1). Population TZEEI 37 was the only genotype that deviated from ranging from +2 to +3. A deviation to the right of ranging from +1 to +2 was revealed in genotypes TZEEI 9 (+1.52), TZEEI 82b (+1.52), TZEI 161 (+1.12), TZEI 1304 (+1.12) and TZEI 9 (+1.12) respectively. A deviation between 0 and +1 was observed in genotype TZEEI 82 (+0.92), TZEI 1315 (+0.92), TZEI 1303(+0.72), TZEI 17 (+0.72), TZEI 1247 (+0.32), TZEEI 8 (+0.12), TZEI 1318 (+0.12), TZEEI 29 (+0.12), TZEI 27 (+0.12), TZEEI 55 (+0.12), TZEEI 8(+0.12). There was no genotype without disease symptom expression.
But a different pattern of deviation range was observed in AUDPC deviation method, the deviation was clearly different from the one expressed by most of the genotype in Rank Sum method. Only genotype TZEEI 82 had a deviation to the right of ranging from +1 to +2 in AUDPC deviation method (Table 2) compared to what was obtainable in Rank Sum method (Table 1). All the genotypes that fell into deviation range of +1 to +2 under Rank Sum method showed a deviation range of +1 to +2 when AUDPC method was used for evaluation and the genotype that showed a deviation range of +2 to +3 under Rank Sum method showed a deviation range of +0.05 under AUDPC deviation method of assessment. All the genotypes that showed a different level of deviation range (-2 to -3, -1 to -2, and -0.08 to -0.88) under Rank Sum method (Table 1) fall under the same category of deviation (-0.05 to -0.8) under the AUDPC deviation method (Table 2). Spearman’s rank correlation revealed statistical relationship between the two methods of determinant (AUDPC and Rank-sum).
Genotype |
AUDPC |
AUDPCDev |
AUDPCSD |
Class |
TZEEI 82 |
15.75(30) |
7.73 |
1.55 |
S |
TZEI 82 |
13(29) |
4.98 |
0.99 |
MS |
TZEI 1304 |
12.25(28) |
4.23 |
0.85 |
MS |
TZEEI 9 |
11.25(27) |
3.23 |
0.65 |
MS |
TZEI 1315 |
10.5(26) |
2.48 |
0.5 |
MS |
TZEEI 55 |
9.5(25) |
1.48 |
0.3 |
MS |
TZEI 161 |
9.25(24) |
1.23 |
0.25 |
MS |
TZEI 17 |
9.25(24) |
1.23 |
0.25 |
MS |
TZEI 1303 |
9(23) |
0.98 |
0.2 |
MS |
TZEI 27 |
9(23) |
0.98 |
0.2 |
MS |
TZEI 9 |
8.75(22) |
0.73 |
0.15 |
MS |
TZEEI 29 |
8.5(21) |
0.48 |
0.1 |
MS |
TZEI 1247 |
8.25(20) |
0.23 |
0.05 |
MS |
TZEI 1318 |
8.25(20) |
0.23 |
0.05 |
MS |
TZEEI 37 |
8.25(20) |
0.23 |
0.05 |
MS |
TZEI 1305 |
7.75(19) |
-0.27 |
-0.05 |
MR |
TZEI 65 |
7(18) |
-1.02 |
-0.2 |
MR |
TZEEI 6 |
7(18) |
-1.02 |
-0.2 |
MR |
TZEEI 8 |
7(18) |
-1.02 |
-0.2 |
MR |
TZEEI 8 |
7(18) |
-1.02 |
-0.2 |
MR |
TZEI 35 |
6.5(17) |
-1.52 |
-0.3 |
MR |
TZEEI 1 |
6.5(17) |
-1.52 |
-0.3 |
MR |
TZEI 1312 |
6.5(17) |
-1.52 |
-0.3 |
MR |
TZEI 187 |
5.75(16) |
-2.27 |
-0.45 |
MR |
TZEEI 21 |
5.5(15) |
-2.52 |
-0.5 |
MR |
TZEI 14 |
5(14) |
-3.02 |
-0.6 |
MR |
TZEI 1271 |
5(14) |
-3.02 |
-0.6 |
MR |
TZEEI 108 |
4.75(13) |
-3.27 |
-0.65 |
MR |
TZEI 10 |
4.5(12) |
-3.52 |
-0.7 |
MR |
TZEI 1250 |
4(11) |
-4.02 |
-0.8 |
MR |
Table 2 Relative resistance of some maize population to (NLBD) as determined by AUDPC
AUDPC, Area under the disease progress curve and rank scores; AUDPCDev, Deviation from the grand mean of the rank scores of AUDPC values & resistance category; AUDPCSD, Product of deviation of AUDPC and constant (0.2); Highly susceptible; S, Susceptible; MS, Moderately susceptible; HR, Highly resistant; R, Resistant; MR, Moderately resistance
Screening for crop disease resistance requires assessment of arrays of genotypes with the aim of grouping genotypes into particular disease response class.19 Symptoms observed on the infected plants were similar to those reported by Vivek et al (2009). The observation that all the inoculated plants expressed symptoms of NLB disease shortly after inoculation shows that there was no immunity against the fungi in the evaluated genotypes. This finding corroborates the results published by Vivek B,4 who reported that different NLB strains induced blight symptoms in not more than one week when plants were inoculated at the early growth stage. Leaf scorching has grave implications on plants ability to photosynthesize. This is because fungi hijack the chloroplast and physiology of the attacked plants. However, pathogen movement and accumulation in plants basically depends on the genetic makeup of the attacked plant and the outcome of their interactions determines the concentration of the pathogen in the host.8 The genotypes which produced mild symptoms of NLB at the later stage of screening could be described as being tolerant to infection. Studies revealed tolerance as one of the popular mechanisms for compensating the stressed imposed by parasites is elicited by reducing the deleterious impacts of parasite infection which could be manifested as alteration of host life-history characteristics.20
The highest DI score (80) recorded by genotype TZEEI 37 with high standard deviation values (2.52) implied that this genotype is highly susceptible to NLB disease among the evaluated genotypes. Genotypes TZEI 161 and TZEI 9 had equal DI (80) values with genotypes TZEI 37 but had higher ISS values than the former but lower SD values 1.12. This showed the genotypes are susceptible to NLB disease. Highest ISS value (3.5) revealed by genotype TZEI 82 implies the genotype is susceptible to NLB disease due to its SD value (1.52). The lowest ISS value revealed by genotype TZEEI 1271 indicates that the genotype has the highest resistance strength among the genotypes. Only genotype TZEEI 37 falls within a range of +2 and +3 under Rank sum method of evaluation, indicating the high susceptibility strength of the genotype (HS). A deviation range to the right from+1 to +2 observed in genotypes TZEEI 9, TZEEI 1304, TZEEI 161, TZEEI 82 and TZEEI 9 with Rank sum method indicates that they are susceptible (S), while the other genotypes showed a deviation within the range of 0 and +1, which signifies moderate susceptibility (MS) with Rank-sum method.
Genotype TZEI 1312, 1250, 14, 187, and TZEEI 108 showed a deviation range within –1 and –2, signifying resistance (R) with Rank-sum method, while genotypes TZEEI 10, 65, 1305, TZEEI 21, 6, and 1 showed a deviation range between –0 and –1 only. Genotype TZEEI 1271 alone had a deviation range between –2 and –3, thus revealing that its highly resistance (HR) with Rank-sum method. The rank-sum method allowed combining the ranks for DI and ISS, and grouping genotypes into specific resistance classes. It is assumed that variation between genotypes classified as MR or MS as well as within levels of resistance (MR, R, HR) or susceptibility (MS, S, HS) may have been influenced by the more subjective rating scale used for ISS. However, genotypes TZEI 187, TZEEI 108, TZEI 14, TZEI 1250, TZEI 1312, and TZEI 1271 were consistently classified as HR or R using the rank-sum method, while they were classified to MR group by AUDPC method. There was a low level of agreement between the two methods for resistant class determination owing to the differences in the principles involved.
From the results reported in this study, AUDPC method recognized one class of resistance (MR) and two classes of susceptibility (S and MS), meanwhile three classes of resistance (HR, R and MR) and susceptibility (HS,S and MS) were operative in Rank–sum Method. This shows that Rank-sum method is more precise and accurate in grouping maize plant to different disease response class than AUDPC. In addition, AUDPC appears less stringent in grouping genotypes into resistant classes relative compare to rank-sum method, especially with respect to the number of genotypes found in the resistant and highly resistant classes. As shown in the results, the tendency of placing a highly susceptible cultivar in either moderately susceptible or susceptible group is relatively high using AUDPC, while the chances can be relatively rule out when rank-sum method is employed. However, if the essence of genotype evaluation is to determine only two classes of disease response (resistant and susceptible), both methods can be employed because there was 100 % agreement with respect to the genotypes found in each group. But when determining more than two classes of genotype’s reaction to disease infection, rank-sum method appears best. The results of the present study has proved AUDPC method to be less effective with high tendency of introducing error when grouping maize genotypes into different disease response class despite its simplicity, compare to Rank-sum method which appear a bit cumbersome but more accurate, sensitive and precise.

©2019 OHUNAKIN, et al. This is an open access article distributed under the terms of the, which permits unrestricted use, distribution, and build upon your work non-commercially.