Advances in
eISSN: 2373-6402


Directions and fruit distribution on trees plays important role in infestation percentage by B. zonata on guava in current case seems that the peach fruit fly, B. zonata prefer to concentrate on the east-North direction. Where the North side recorded the highest level by B.zonata infestation, so the east-North direction may be the most suitable corner to hanging traps on the trees.
The fruit flies (Family: Tephritidae) are important group of insect pests of horticulture production throughout the world. Over 1500 fly species occur wide of which 50 species are regarded as major pests and another 30 species are of minor economic importance.1 Peach fruit fly (PFF), Bactrocera zonata (Saunders) (Diptera: Tephritidae) is known as the most serious pest of tropical and subtropical fruits.2 The peach fruit fly B. zonata is a polyphagous insect. Its main hosts are guava, mango and peach. Secondary hosts include apricot, fig and citrus. This fly has been recorded on over 50 cultivated and wild plant species, mainly those with fleshy fruits. In 1914, this pest was detected for the first time in Egypt (Efflatoun 1924). Due to the appropriate environmental conditions and availability of their hosts, it had wide spread in Egypt where it was recorded in different locations such as Alexandria,3Kalubia,4 El-Beheira,5 the whole Nile Delta region, Nile Valley and Kharga and Dakla oases, North Sinai Governorate (North-East) Governorates.,6 Assiut, Sohag and New Valley). It is causing estimated 190 million € damage a year.4,7 Traps are a good tool for control predicts with population and infestation percentage, Efficiency of traps on attracts fruit flies depend in trapping system. These Trapping systems including traps (Types, shape, color and heights), lures, and attractants; it also with relation to weather factors, in addition to the preference of fruit flies to host fruits. the fruit distribution on trees have a vital role on giving areal ratio about population of fruit by affecting on traps efficiency on caching flies and infestation percentage by B. zonata on different host trees. This study aims to know Relationship between–directions, fruit distribution on trees and infestation percentage by B. zonata on guava fruit by determine effect of the main cardinal directions on the infestation percentage.
Present study carried out during fruit season, 2013 in guava host tree. Three trees were selected randomly each tree was divide to two levels, the first, the upper level from 2m high from ground and the second level is down level from the ground surface to 2m high rate, tree were divide to two levels up level was more than 2m from the ground and down level was at 2m height from the ground and each level divide to main four direction of the tree, North, West, East and South directions. ten fruit were selected randomly from each direction for each level, The total number of fruits and number of infested fruits were counted and then were converted to percent infestation by the following formula.
Direction effect on infection percentage by the peach fruit fly B.zonata on guava host: The present study was carried out to determine the prefer direction and-ion compare the within- tree distribution of B. zonata infestation on the host tree of each quadrant (North, East, West and South) at the up and down level of the tree. Effect of directions and levels of Guava trees on the peach fruit fly, B.zonata infestation percentage during season 2013: Data presented in Table 1 and Figure 1 revealed that for Guava trees the infestation percentage by B.zonata was significantly higher in the north side of the tree with (76%) compare to the other sides through the seasons 2013. The other side’s direction harbored moderately level of infestation (55%, 54% and 47%) in south, east and west respectively. According to Figure 2 the lowest infestation percentage was recorded in June (19%) flowed by December (22%), while. The higher infestation percentage recorded in September (64%). As showed in Figure 2 that the PFF The infestation were suspended at north direction were higher with 32.76%, followed by south direction with 23.71% and 23.28 %and 20.26 %for east and west direction respectively for North direction, it's clear that the PFF males prefer to concentrate on the West-North direction.
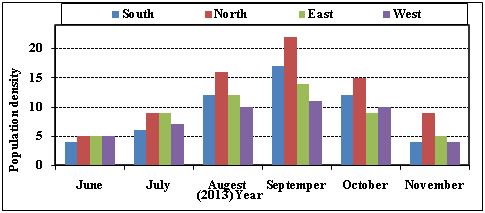
Figure 1 preference direction of PFF males B.zonata, at main cardinal directions in up level during 2013 season.
Date |
South |
North |
East |
West |
Total |
June |
4 |
5 |
5 |
5 |
19 |
July |
6 |
9 |
9 |
7 |
31 |
August |
12 |
16 |
12 |
10 |
50 |
September |
17 |
22 |
14 |
11 |
64 |
October |
12 |
15 |
9 |
10 |
46 |
November |
4 |
9 |
5 |
4 |
22 |
Total |
55 |
76 |
54 |
47 |
232 |
Mean |
9.2 |
12.7 |
9 |
7.8 |
66.3 |
% |
23.7 |
32.8 |
23.3 |
20.3 |
100 |
Table 1 Direction effect on Infection percentage by the peach fruit fly B. zonata on guava host during season 2013 on up level
Figure 2: preference direction of PFF males B. zonata, at main cardinal directions in up level during 2013 season Effect of directions and levels of Guava trees on infestation percentage by the peach fruit fly, B. zonata infestation percentage during season 2013: Data presented in Table 2 and Figure 3 revealed that for Guava trees the percentage of B. zonata infestation level have the same trend of the up level where there was significantly higher in the north and east sides of the tree compare to the other side with 57% and 45%. While the other side direction harbored moderately level of infestation (39% and 37%) in west and south respectively. The lowest infestation percentage was recorded in June (11%) flowed by December (14%), while the higher infestation percentage recorded in September (53%). As showed in Figure 4 that the PFF the infestation were suspended at north direction were higher with 32.02%, followed by east direction with 25.28% and 21.91%and 20.79% for west and south direction respectively.
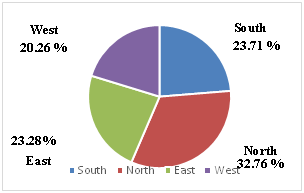
Figure 2 preference directions of PFF males B.zonata, at main cardinal directions in up level during 2013 season.
Date |
South |
North |
East |
West |
Total |
June |
2 |
5 |
2 |
2 |
11 |
July |
4 |
5 |
9 |
7 |
25 |
August |
6 |
12 |
11 |
10 |
39 |
September |
12 |
16 |
14 |
11 |
53 |
October |
11 |
13 |
7 |
5 |
36 |
November |
2 |
6 |
2 |
4 |
14 |
Total |
37 |
57 |
45 |
39 |
178 |
Mean |
6.2 |
9.5 |
7.5 |
6.5 |
50.9 |
% |
20.8 |
32 |
25.3 |
21.9 |
100 |
Table 2 Direction effect on Infection percentage by the peach fruit fly B. zonata on guava host during season 2013 on down level
Effect of directions and levels of Guava trees on infestation percentage by the peach fruit fly, B. zonata infestation percentage in the upper level during season 2014: Data presented in Table 3 and Figure 5 revealed that for Guava trees the percentage of B. zonata infestation level was significantly higher in the north side of the tree compare to the other side with 74%.also it was significantly lower in the west side of the tree compare to the other sides with 44%. The other side direction harbored moderately level of infestation (55%, 52% and 47%) in east and south respectively. The lowest infestation percentage was recorded in June (13%) flowed by December (21%), while. The higher infestation percentage recorded in September (63%), flowed by August and October. As showed in Figure 6 that the PFF The infestation were suspended at north direction were higher with 32.89%, followed by east direction with 24.44% and 23.11% and 19.56% for south and west direction respectively for North direction, it's clear that the PFF males prefer to concentrate on. The West-North direction.
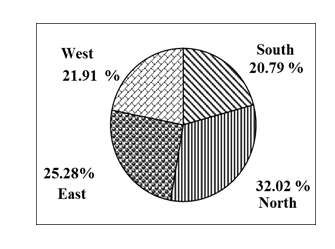
Figure 4 Preference direction of PFF B. zonata, at main cardinal directions in down level during 2013 season.
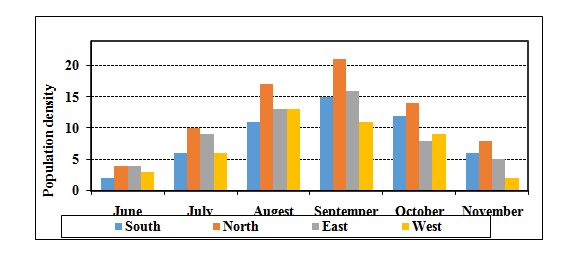
Figure 5 Average preference direction of PFF B. zonata, at main cardinal directions in up level during 2014 season.
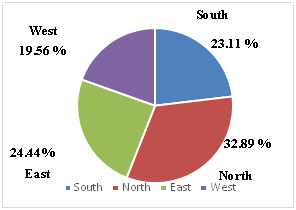
Figure 6 Average preference direction of PFF B. zonata, at main cardinal directions in up level in 2014 season.
Date |
South |
North |
East |
West |
Total |
June |
2 |
4 |
4 |
3 |
13 |
July |
6 |
10 |
9 |
6 |
31 |
August |
11 |
17 |
13 |
13 |
54 |
September |
15 |
21 |
16 |
11 |
63 |
October |
12 |
14 |
8 |
9 |
43 |
November |
6 |
8 |
5 |
2 |
21 |
Total |
52 |
74 |
55 |
44 |
225 |
Mean |
8.7 |
12.3 |
9.2 |
7.3 |
64.3 |
% |
23.1 |
32.9 |
24.4 |
19.6 |
100 |
Table 3 Direction effect on Infection percentage by the peach fruit fly B. zonata on guava host during season 2014 on up level
Effect of directions and levels of Guava trees on infestation percentage by the peach fruit fly, B. zonata infestation percentage in the down level during season 2014: Data presented in Table 4 and Figure 7 revealed that for Guava trees the percentage of B. zonata infestation level was significantly higher in the north side of the tree compare to the other side with 60%. The other side direction harbored moderately level of infestation (45%, 40% and 38%) in east, west and south respectively. The lowest infestation percentage was recorded in June (4%) flowed by December (16%). while, the higher infestation percentage recorded in September (53%). As showed in Figure 8 that the PFF The infestation were suspended at north direction were higher with 32.79%, followed by east direction with 24.59% and 21.86 %and 20.77 %for west and south direction respectively for North direction, It is clear that the PFF males prefer to concentrate on the West-North direction. From the previous results, it could be concluded that the peach fruit fly, B. zonata prefer to concentrate on the east-North direction. Where the North side recorded the highest level by B. zonata infestation, this observed could be attributed to the preference of the adult females.
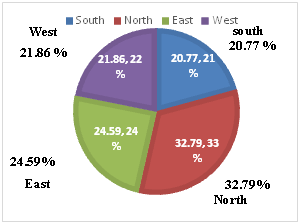
Figure 8 Average preference direction of PFF B. zonata, at main cardinal directions in down level during 2014 season.
Date |
South |
North |
East |
West |
Total |
June |
1 |
1 |
1 |
1 |
4 |
July |
4 |
7 |
8 |
7 |
26 |
August |
10 |
16 |
9 |
12 |
47 |
September |
13 |
18 |
12 |
10 |
53 |
October |
8 |
12 |
9 |
8 |
37 |
November |
2 |
6 |
6 |
2 |
16 |
Total |
38 |
60 |
45 |
40 |
183 |
Mean |
6.3 |
10 |
7.5 |
6.7 |
52.3 |
% |
20.8 |
32.8 |
24.6 |
21.9 |
100 |
Table 4 Direction effect on Infection percentage by the peach fruit fly B. zonata on guava host during season 2013 on down level
This preference seems to be controlled by the micro environmental factors influencing female oviposition. The activity of female in oviposition increased during early and late of the day more than the mid-day probably due to the climatic conditions that prevailed at the morning. According, the favorable situation on tree sectors, for B.zonata oviposition, may be controlled by the microclimatic conditions prevailed in these situation, this difference in temperature beside the intensity of sunshine between the seasons could be responsible for B.zonata orientation to certain sector according to the tree. The results is agree with Gaperallah et al.,8 who found that the east direction was the higher infestation at the four main directions and receiving a highest significant number of PFF ,followed by North. also Hashem et al. (2003) who found that the West direction was the best position for placing Jackson traps at the four main directions and field center to receiving a highest significant number of PFF males, followed by North Center, East and south directions, respectively. While, Calkins et al.,9 detected the population activity of Anastrepha suspensa by using McPhail traps within the foliage in the northeast of each design, Draz et al.,5 showed that the number of capture MFF was at North, West, East and South directions, respectively. On the other hand, Pelz-Stelinski et al.,10 suspended traps of R. cingulata in the southwest direction of cherry trees; it was hanged at southeast direction for trapped of MFF. Qureshi et al.,11 who found that the most PFF dispersed in southwestern and south direction when the wind was predominantly west southwest might support this fact.
None.
Author declares that there is no conflict of interest.

© . This is an open access article distributed under the terms of the, which permits unrestricted use, distribution, and build upon your work non-commercially.