Advances in
eISSN: 2373-6402


The experiment was conducted to detect the effect of PVY and PLRV on growth and yield of four different potato varieties namely Asterix, Cardinal, Diamant and Granula resulting the rate of degeneration of potato varieties at three successive cropping seasons viz. 2010-11, 2011-12 and 2012-13. Three different generations namely 1st, 2nd and 3rd generation were used. Positive significant correlation was found between aphid population and spread of PVY and PLRV. The percent infection of PVY was ranged from 10.8-16.7%, 19.2- 37.5% and 39.2-61.7% in 1st, 2nd and 3rd generations, respectively depending on the varieties. Whereas, PLRV infection varied from 5.0-10.0%, 27.5-30.8% and 37.5-52.5% in 1st, 2nd and 3rd generations, respectively depending on the varieties. Asterix and Diamant are more tolerant than that of Cardinal and Granule. 1st generation was produced maximum number of tubers per hill, yield per hill and seed yield per plot compared to 2nd and 3rd generations all the four potato varieties. Diamant showed less degeneration effect on number than the other varieties. Asterix and Diamant performed better than that of Cardinal and Granule in all the cases. PVY causes more severe reduction of yield per hill than that of PLRV.
Keywords: potato, varieties, degeneration, virus
PVY, potato virus Y; PLRV, potato leaf roll virus; BADC, Bangladesh agricultural development corporation; BSMRAU, Bangabandhu Sheikh Mujibur Rahman agricultural university
Seed potato degeneration is the buildup of diseases in potatoes over seasons, as a result of replanting tubers infected with viruses or other seed borne diseases. The degeneration of potato is appeared either due to physiological causes or due to infection of tuber-borne viruses specially PVY and PLRV.1 PVY and PLRV are the two tuber-borne viruses causing tremendous damage to the potato crop also caused degeneration on seed potato production.2 It has been recognized that the poor yield of potato is attributed due to use of virus infected seed potato specially infected by PVY and PLRV.3,4 Seed potato infected with PVY and PLRV seem to be degenerated following the successive generation,5 is an acute problem of seed potato production in Bangladesh.6 So it is highly important to evaluate the denegation behavior of potato due to infection of PVY and PLRV. Therefore, the present study was undertaken to detect the effect of PVY and PLRV on growth and yield of four different potato varieties resulting the rate of degeneration of potato varieties at three successive seasons.
The experiment was conducted at Tissue Culture Laboratory of BADC, Kashimpur and Plant Pathology Laboratory of BSMRAU, Gazipur-1706, Dhaka, Bangladesh during winter 2010-11, 2011-12 and 2012-13 cropping seasons. Seed potatoes of the variety Asterix, Cardinal, Diamant and Granula representing three different generations namely 1st, 2nd and 3rd generation were used for the experiments conducting in 2010-11, 2011-12 and 2012-13, respectively. The seed potato obtained from 2010-11 experiments was used for the subsequent years. Four Moericke yellow water traps (Figure 1) were set up in four locations of the experimental field of BSMRAU Research Farm. The counting of aphids was initiated from third week of November 2011. Half of the yellow trap was filled with tap water where few drops of liquid soap were added so that the aphids could not fly after falling on to the traps. The trapped aphids were collected from the trays twice in a week at 11 a.m. and it was continued up to the date of haulm pulling. The water of the traps was changed after aphid collection. The collected aphids were preserved in plastic bottles containing 70% alcohol to identify the vector aphid. Relationship of aphid populations as well as correlation and regression between population of aphid vector and incidence of PVY and PLRV were employed to interpret the data. During the crop seasons of 2010-11, 2011-12 and 2012-13, tuber samples preserved in the cold stored were planted in the field respectively on November 22, 2010, November 22, 2011 and November 22, 2012. The crop was harvested on, March 4 for every seasons of 2010-11, 2011-12 and 2012-13.
Spread of PVY and PLRV in the field in relation to aphid population
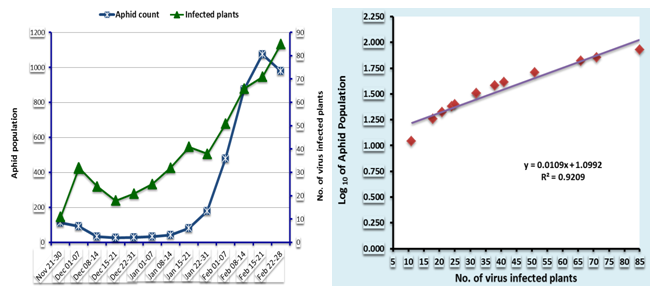
It was found that incidence of both PVY and PLRV infection increased with the increased of aphid population and there was a positive significant correlation between aphid population and spread of the viruses (Figure 2). The relationship between two variables was linear and could be described by linear regression equations of y=0.0109x+1.0992 (R2=0.921). The R2 values indicate that the change in disease incidence might be attributed to aphid population by 92%. Since the PVY and PLRV are transmitted by aphids in the field, it is scientifically logical that high spread of virus would be dependent upon the aphid population in the field. The results of present study are of agreement with the study of the previous workers.7–11
Incidence of PVY and PLRV
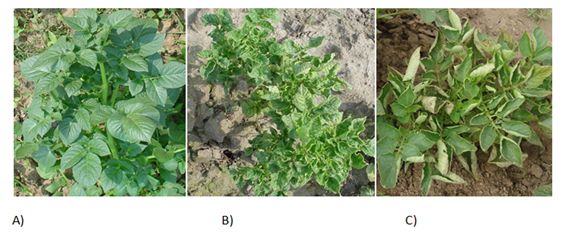
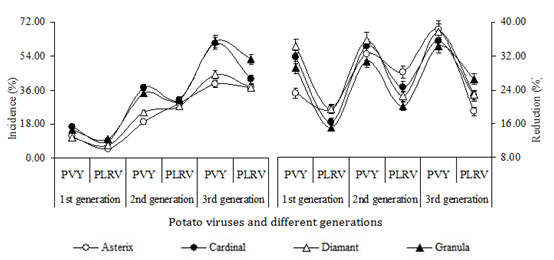
Incidence of PVY and PLRV were identified based on characteristic symptoms of the viruses appeared on plants. Initially infection of PVY was recognized as mild mosaic symptom. Gradually dead tissue appeared on the leaves near the veins. At advanced stage of infection partly or whole leaflets become dead. The primary symptoms of PLRV appeared in young leaves in the top of the plants. Such leaves stand upright, are pale yellow. In later stage, upward rolling of the leaf margins is to be visible. Secondary symptoms are always more serious for the whole plant. The basal leaves are stiff and may show a marked upward rolling of the leaf margins (Figure 3). Disease incidence varied depending on seed potato generations, varieties as well as between the two viruses. Virus prevalence is increased with increase of generation and PVY is more prevalent than PLRV. Asterix and Diamant are more tolerant than that of Cardinal and Granula. The percent infection of PVY was ranged from 10.8-16.7 %, 19.2- 37.5% and 39.2-61.7% in 1st, 2nd and 3rd generations, respectively depending on the varieties. Whereas, PLRV infection varied from 5.0-10.0%, 27.5-30.8% and 37.5-52.5% in 1st, 2nd and 3rd generations, respectively depending on the varieties (Figure 4). The incidence of PVY and PLRV in seed potato crop had also been studied by several investigators.5–16
Plant height
In case of PVY infected seed tubers 1st, 2nd and 3rd generation produced plant height of 48.1, 42.8 and 38.5 cm respectively, where plant height of PLRV infected tubers was 56.2, 48.9 and 46.9 cm in 1st, 2nd and 3rd generation respectively (Table 1). It was found that height was reduced in plants raised from PVY and PLRV infected tubers. In case of all the variety and generations, plant height reduction found higher in PVY infected plants than that of PLRV infected plants. However the rate of reduction increased with the increase of generation. The reduction was noted among the varieties as 23.2-34.3%, 30.7-35.8% and 34.3-38.3% for PVY infection in 1st, 2nd and 3rd generation, respectively compared to healthy. Whereas, the height reduction for PLRV infection was 15.0-19.5%, 20.1-28.2% and 18.9-26.6% in 1st, 2nd and 3rd generation, respectively, compared to healthy (Figure 4).
Potato variety |
Plant height (cm) of potato varieties at different generations |
|||||||||||
1st Generation |
2nd Generation |
3rd Generation |
||||||||||
Healthy |
PVY |
PLRV |
Mean |
Healthy |
PVY |
PLRV |
Mean |
Healthy |
PVY |
PLRV |
Mean |
|
Asterix |
72.30 a |
55.51 f-t |
58.19 d-h |
62.00 a |
66.12 a-d |
44.63 l-o |
47.50 i-n |
52.75 b-d |
63.35 a-e |
39.06 no |
51.36 g-l |
51.26 def |
Cardinal |
67.46 a-e |
46.00 k-o |
56.36 e-i |
56.61 b |
63.10 b-f |
41.46 m-o |
47.53 i-n |
50.69 d-f |
59.68 b-g |
38.47 o |
46.26 j-o |
48.13 ef |
Diamant |
68.48 ab |
45.00 l-o |
55.19 f-j |
56.22 bc |
64.88 a-e |
41.65 m-o |
50.25 h-m |
52.26 b-e |
60.12 b-g |
37.45 o |
46.38 j-o |
47.98 ef |
Granula |
64.64 a-e |
45.70 l-o |
54.92 f-k |
55.08 b-d |
62.75 b-e |
43.46 l-o |
50.13 h-m |
52.11 c-e |
59.31 c-g |
38.98 no |
43.56 l-o |
47.28 f |
G. Mean |
68.22 a |
48.05 d |
56.16 c |
57.48 a |
64.21 b |
42.80 e |
48.85 d |
51.95 b |
60.61 b |
38.49 f |
46.89 d |
48.66 c |
Table 1 Degeneration effect of PVY and PLRV on plant height (cm) of four potato varieties planted at three subsequent years (2011 to 2013)
*Values within the same row and column with same letters are not significantly different at 5% level by Tukey’s HSD test
Number of stem per hill
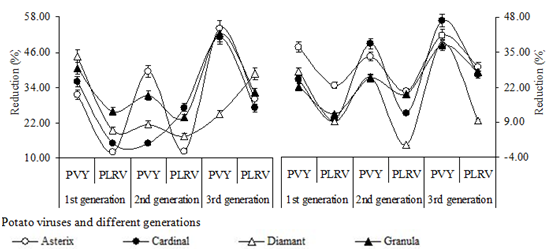
It was found that in all generations the number of stem per hill was higher in the plants grown from healthy tubers compared to PVY and PLRV infected tubers. In case of PVY infected seed tubers 1st, 2nd and 3rd generation seed potato produced average stem number of 2.9, 2.9 and 2.1 respectively among the four varieties (Table 2). Whereas the numbers of stems per hill in PLRV infected plants were recorded as 3.8, 3.2, and 2.6 in 1st, 2nd and 3rd generation, respectively depending on varieties. The highest number of stem was found in 1st generation in each case which differed significantly among the other generations (Table 2). It was observed that the number of stem was reduced in plants raised from PVY and PLRV infected tubers compared to healthy ones. The rate of stems reduction increased with the increase of generation and effect of PVY was more severe than that of PLRV. The reduction was recorded among the varieties as 31.5-44.6%, 14.9-39.6% and 24.9-54.0% for PVY infection in 1st, 2nd and 3rd generation respectively compared to healthy ones. Whereas, reduction in stem number for PLRV infection among the varieties was recorded as 12.1-44.6%, 12.3-27.1% and 27.1-38.7% in 1st, 2nd and 3rd generation, respectively, compared to healthy plants (Figure 5). Production of reduced number of stem in PVY and PLRV infected plants.17–19
Potato variety |
Number of stems per hill of potato varieties at different generations |
|||||||||||
1st generation |
2nd generation |
3rd generation |
||||||||||
Healthy |
PVY |
PLRV |
Mean |
Healthy |
PVY |
PLRV |
Mean |
Healthy |
PVY |
PLRV |
Mean |
|
Asterix |
4.98 a |
3.41 a-h |
4.38 a-d |
4.26 a |
4.55 a-c |
2.75 d-i |
3.99 a-e |
3.77 ab |
4.11 a-e |
1.89 g-i |
2.88 c-i |
2.96 b-d |
Cardinal |
4.36 a-d |
2.79 d-i |
3.71 a-e |
3.62 ab |
3.76 a-e |
3.20 b-i |
2.74 d-i |
3.23 b-d |
3.40 a-h |
1.66 i |
2.48 e-i |
2.51 d |
Diamant |
4.44 a-d |
2.46 e-i |
3.58 a-g |
3.49 a-c |
4.00 a-e |
3.14 b-i |
3.30 a-i |
3.48 a-c |
3.85 a-e |
2.89 c-i |
2.36 f-i |
3.03 b-d |
Granula |
4.86 ab |
2.89 c-i |
3.60 a-g |
3.79 ab |
3.75 a-e |
2.58 e-i |
2.86 c-i |
3.07 b-d |
3.69 a-e |
1.76 hi |
2.50 e-i |
2.65 cd |
G. Mean |
4.66 a |
2.89 d |
3.82 bc |
3.79 a |
4.02 ab |
2.92 d |
3.22 cd |
3.38 b |
3.76 bc |
2.05 e |
2.55 de |
2.79 c |
Table 2 Degeneration effect of PVY and PLRV on number of stems per hill of four potato varieties planted at three subsequent years (2011 to 2013)
*Values within the same row and column with same letters are not significantly different at 5% level by Tukey’s HSD test
Number of tuber
Potato tubers infected with either PVY or PLRV in different generations of potato reduced the numbers of tubers per plant compared to healthy. Maximum number of tubers per hill was produced in all the four potato varieties of 1st generation compared to 2nd and 3rd generations (Table 3). In case of PVY infected plants of all the four varieties, the highest number of tubers (7.6/hill) was obtained from 1st generation followed by 2nd (6.8/hill) and 3rd (5.7/hill) generation (Table 3). The average tuber number of PLRV infected plants of four varieties was 9.2, 8.6 and 7.6 in 1st, 2nd and 3rd generation, respectively and these were also differed statistically among one another (Table 3). Reduced number of tubers was produced from PVY and PLRV infected tubers in all generations and reduction rate was lower in 1st generation which was gradually increased with the increase of generations also the effect of PVY was more severe than that of PLRV. Diamant was found to be good in respect of less degeneration effect on tuber numbers. The reduction was recorded among varieties as 22.2-36.9%, 25.3-38.3% and 37.7 -46.8% for PVY infection in 1st, 2nd and 3rd generation respectively compared to healthy. Similar trend was observed in case of PLRV infection where the reduction were noted as 9.2-22.7%, 0.6-20.4% and 9.6-29.5% in 1st, 2nd and 3rd generations respectively (Figure 5). Cellular changes in potato by virus ultimately affected the quality as well as quantity of seed potato production.20,21
Potato variety |
Number of tubers per hill of potato varieties at different generations |
|||||||||||
1st generation |
2nd generation |
3rd generation |
||||||||||
Healthy |
PVY |
PLRV |
Mean |
Healthy |
PVY |
PLRV |
Mean |
Healthy |
PVY |
PLRV |
Mean |
|
Asterix |
11.00 ab |
6.94 i-m |
8.50 c-i |
8.81 b |
10.13 a-d |
6.75 i-m |
8.06 c-l |
8.31 bc |
9.69 a-e |
5.69 lm |
6.83 i-m |
7.40 c |
Cardinal |
10.06 a-d |
7.56 e-m |
9.06 a-i |
8.90 ab |
9.63 a-g |
5.94 k-m |
8.44 c-j |
8.00 bc |
9.75 a-e |
5.19 m |
7.13 h-m |
7.35 c |
Diamant |
11.50 a |
8.31 c-k |
10.44 a-c |
10.08 a |
10.00 a-e |
7.44 f-m |
9.94 a-e |
9.13 ab |
9.75 a-e |
6.00 j-m |
8.81 b-i |
8.19 bc |
Granula |
9.88 a-f |
7.69 d-l |
8.69 a-e |
8.75 b |
9.63 a-g |
7.19 g-m |
7.75 d-l |
8.19 bc |
9.50 a-h |
5.92 k-m |
6.88 i-m |
7.43 c |
G. Mean |
10.61 a |
7.63 de |
9.17 bc |
9.14 a |
9.84 ab |
6.83 e |
8.55 cd |
8.41 b |
9.67 ab |
5.70 f |
7.41 e |
7.59 c |
Table 3 Degeneration effect of PVY and PLRV on number of tubers per hill of four potato varieties planted at three subsequent years (2011 to 2013)
*Values within the same row and column with same letters are not significantly different at 5% level by Tukey’s HSD test
Yield of seed potato
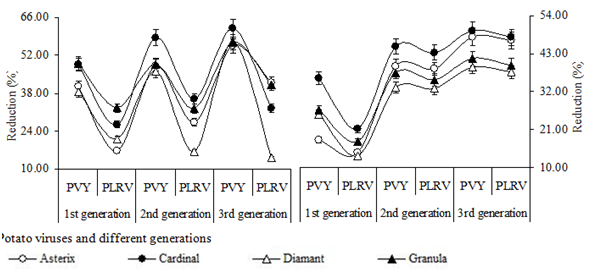
The results of the study revealed that in all the cases the yield per hill (g) of all the four varieties was significantly higher in 1st generation compared to 2nd and 3rd generation and significantly higher yield was obtained from healthy plants compared to PVY and PLRV infected plants in all the four varieties. Moreover, the PVY infected plants yielded significantly less amount of tubers than that of PLRV infected plants of all the four potato varieties (Table 4). In case of 1st generation, on an average the highest yield was recorded from Asterix (298.8g) and the lowest from Granula (253.8g). In case of 2nd and 3rd generation, the highest yield was obtained from Diamant (271.7g and 254.8g respectively) (Table 4). PVY causes more severe reduction of yield per hill than that of PLRV and this rate was increased with the increase of generation. Asterix and Diamant performed better than that of Cardinal and Granula in all the cases (Figure 6). Similar trends also observed in case of seed yield (kg/plot) of four potato varieties in three subsequent generations. In all the cases, significantly highest yield was obtained from healthy plants of all the four potato varieties compared to PVY and PLRV infected plants. However, the yield was varied depending on varieties and seed potato generations (Table 5) (Figure 6). Significantly the highest seed yield was obtained in case of 1st generation seed potatoes compared to 2nd and 3rd generation. In case of 1st generation, the highest yield was obtained from Diamant and Asterix and the lowest from Cardinal.
Potato variety |
Yield (g) per hill of potato varieties at different generations |
|||||||||||
1st generation |
2nd GENERATION |
3rd generation |
||||||||||
Healthy |
PVY |
PLRV |
Mean |
Healthy |
PVY |
PLRV |
Mean |
Healthy |
PVY |
PLRV |
Mean |
|
Asterix |
369.3 a |
219.8 e-i |
307.5 a-d |
298.8 a |
352.0 a |
182.5 f-j |
256.3 c-e |
263.6 a-d |
340.0 ab |
151.5 h-j |
197.5 f-j |
229.7 de |
Cardinal |
350.5 a |
180.3 f-j |
258.3 b-f |
263.0 a-d |
340.0 ab |
141.3 ij |
218.3 e-i |
233.2 c-e |
323.0 a-c |
123.0 j |
218.3 e-i |
221.4 e |
Diamant |
364.5 a |
224.8 e-h |
287.9 a-e |
292.4 ab |
342.8 a |
185.3 e-j |
287.0 a-e |
271.7 a-c |
333.5 a-c |
143.8 h-j |
287.0 a-e |
254.8 b-e |
Granula |
348.3 a |
177.8 f-j |
235.0 d-g |
253.8 b-e |
315.8 a-d |
162.3 g-j |
213.6 e-i |
230.5 de |
327.0 a-c |
141.3 ij |
192.5 f-j |
230.5 de |
G. Mean |
358.13 a |
200.7 de |
272.2 b |
277.0 a |
337.6 a |
167.8 ef |
243.8 bc |
249.7 b |
330.9 a |
139.9 f |
223.8 cd |
231.5 c |
Table 4 Degeneration effect of PVY and PLRV on yield (g) per hill of four potato varieties planted at three subsequent years (2011 to 2013)
*Values within the same row and column with same letters are not significantly different at 5% level by Tukey’s HSD test
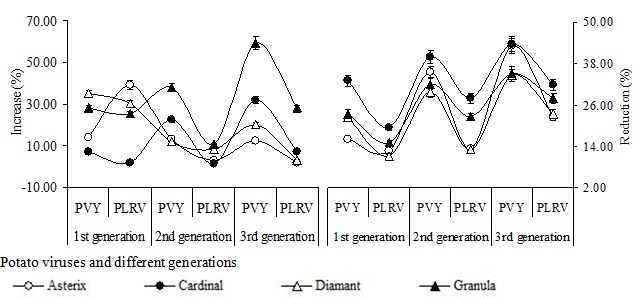
Similar trends also observed in case of 2nd and 3rd generations (Table 5). The percent reduction of seed yield was less in second generation but it was significantly increased in the next subsequent generations. Variety Diamant performed better than that of others as less degeneration observed in respect of seed yield (Figure 6). It was observed that non-seed yield was significantly increased with generations of all varieties (Table 6). Non-seed yield of healthy plants was insignificant among three generations but non-seed production increased with the increase of generations for PVY and PLRV infected plants. While no significant difference among the varieties but highest non-seed yield were recorded from Cardinal followed by Granula, Asterix and Diamant in all three generations (Table 6). Highest increase of non-seed yield was observed in case of 3rd generation PVY infected plants of Granula followed by 1st generation PLRV infected Asterix and 2nd generation PVY infected Granula. However, the increase of non-seed yield ranged from 7.2-34.7%, 12.0-37.3% & 12.4-57.2% for PVY and 1.83-39.1%, 1.2-10.7% & 1.7-28.0% for PLRV in 1st, 2nd and 3rd generations, respectively (Figure 7). The reduction of total yield of potato was found to be varied from 12.8 to 43.6% depending on varieties and generations. Variety Diamant performed better than that of others as less degeneration observed in respect of total yield. Moreover, the PVY causes higher yield reduction than that of PLRV in all the varieties and generations (Figure 7). Considering the per hectare yield (ton) of four potato varieties grown in three different generations from healthy, PVY and PLRV infected tubers degeneration effects of the two tenacious virus were distinctly envisioned.
Potato variety |
Seed yield (kg) per plot of potato varieties at different generations |
|||||||||||
1st generation |
2nd generation |
3rd generation |
||||||||||
Healthy |
PVY |
PLRV |
Mean |
Healthy |
PVY |
PLRV |
Mean |
Healthy |
PVY |
PLRV |
Mean |
|
Asterix |
102.5 a |
84.0 c-f |
87.8 bf |
92.8 a |
97.9 a-c |
59.4 i-l |
60.1 i-l |
89.4 cd |
94.3 a-d |
49.3 kl |
50.14 j-l |
88.0 de |
Cardinal |
99.8 ab |
63.9 h-k |
78.6 e-g |
91.4 a-c |
94.4- a-d |
51.9 j-l |
53.5 jkl |
88.4 de |
92.1 a-e |
46.3 l |
48.16 l |
86.9 e |
Diamant |
103.0 a |
76.8 f-h |
89.2 a-f |
93.0 a |
95.3 a-d |
63.7 h-k |
64.0 h-j |
90.0 b-d |
92.5 a-e |
56.2 i-l |
57.54 i-l |
88.7 de |
Granula |
93.0 a-e |
68.2 g-i |
76.6 f-h |
91.7 ab |
87.7 b-f |
54.8 i-l |
56.7 i-l |
88.8 de |
82.0 d-g |
47.8 l |
49.6 j-l |
88.4 de |
G. Mean |
94.1 a |
90.58 c |
91.9 bc |
92.2 a |
92.7 ab |
86.4 d |
88.2 d |
89.1 b |
92.7 ab |
84.4 e |
86.8 d |
88.0 c |
Table 5 Degeneration effect of PVY and PLRV on Seed yield (kg) per plot of four potato varieties planted at three subsequent years (2011 to 2013)
*Values within the same row and column with same letters are not significantly different at 5% level by Tukey’s HSD test
Potato variety |
Non-Seed Yield(kg) per plot of potato varieties at different generations |
|||||||||||
1st GENERATION |
2nd generation |
3rd generation |
||||||||||
Healthy |
PVY |
PLRV |
Mean |
Healthy |
PVY |
PLRV |
Mean |
Healthy |
PVY |
PLRV |
Mean |
|
Asterix |
6.5 b-e |
7.4 a-e |
9.0 ab |
7.2 e |
7.6 a-e |
8.5 a-d |
7.8 a-e |
10.6 bc |
7.7 a-e |
8.7 a-c |
7.9 a-e |
12.0 ab |
Cardinal |
7.1 a-e |
7.6 a-e |
7.3 a-e |
8.6 c-e |
7.6 a-e |
9.3 ab |
7.7 a-e |
11.7 ab |
7.5 a-e |
9.9 a |
8.0 a-e |
13.1 a |
Diamant |
5.4 e |
7.3 a-e |
7.1 a-e |
7.0 e |
7.5 a-e |
8.4 a-e |
8.1 a-e |
10.1 b-d |
7.7 a-e |
9.2 ab |
7.9 a-e |
11.4 ab |
Granula |
5.9 c-e |
7.5 a-e |
7.4 a-e |
8.3 de |
6.8 b-e |
9.4 ab |
7.5 a-e |
11.2 ab |
5.6 de |
8.9 ab |
7.2 a-e |
11.6 ab |
G. Mean |
5.9 e |
9.4 c |
8.1 cd |
7.8 c |
7.3 de |
13.6 b |
11.8 b |
10.9 b |
7.3 de |
15.6 a |
13.2 b |
12.0 a |
Table 6 Degeneration effect of PVY and PLRV on non-seed yield (kg) per plot of four potato varieties planted at three subsequent years (2011 to 2013)
*Values within the same row and column with same letters are not significantly different at 5% level by Tukey’s HSD test
Healthy plants of all the four different varieties gave almost static yield that not significantly differed among the generations and within the varieties also except the variety Granula of 3rd generation. Whereas, that will differed significantly in case of PVY and PLRV infected plants of all the four varieties. However, in overall consideration the variety Diamant and Asterix were found to be performed better against the degeneration effect of the two viruses (Table 4). Yield reduction was found to be a common phenomenon due to PVY and PLRV infection which have been studied by many investigators. However, some other factors like physiological degeneration may also be involved with the extent of yield reduction in potato. Among the two viruses PVY was reported to be more damaging compared to PLRV.22–25 The results of the present study followed the same trend as described by the authors mentioned earlier. Results of the present investigation have clearly shown that 1st generation crop gave the best performance in respect of growth and yield contributing characters against PVY and PLRV. The reduction in tuber yield after 2nd generation seemed to be due to incidence of virus diseases. It was supported by the findings that the incidence PVY and PLRV increased whereas tuber yield decreased with the progress of generations. Therefore, it indicated that in yield performance test of newly introduced potato varieties might be continued at least for two successive generations to record their actual yield potential, and usefulness of introduced varieties decreased with the increased of generations of cultivations.
Grade-wise tubers proportion
The results indicated that in all the cases the higher amount of Over and B grade as well as lower amount of A and under grade tubers were obtained from healthy plants as compared to PVY and PLRV infected plants of all seed potato generations (Figure 8) (Figure 9). In case of under size grades the percent amount of healthy, PVY and PLRV infected tubers varied from 1.9-2.3%, 3.5-6.3% & 2.8-4.2% in 1st generation, 3.1-3.8%, 5.2-8.0% & 4.7-7.1% in 2nd generation and 3.7-4.3%, 7.8-10.9% & 6.9-9.7% in 3rd generation respectively (Figure 8). PVY infected plants produced higher proportion of A-grade seed than that of PLRV infected plants of all the four varieties (Figure 8). Whereas, the healthy plants yielded higher proportion of B-grade tuber than that of PVY and PLRV infected plants of all the four potato varieties and this proportions were decreased with the increase of generation (Figure 9). Healthy plants yielded lower proportion of over grade tuber than that of infected plants of all the four seed potato varieties and these proportions were increased with the increase of generation (Figure 9). Most of the cases, PVY infected plants produced lower proportion of over grade seed than that of PLRV infected plants. However, the production of the increased number of under grade (<28mm size) contributed to a great extent to the yield reduction of potato crops through the degeneration effects of the two viruses. The results of the present study are of an agreement with the previous workers.20,21,26
From result of the current study it was clear that degeneration of seed potato was occurred by PLV and PVRY. PVY was more hazardous than PVRY. Asterix and Diamant are more resistant to PVY and PLRV than that of Cardinal and Granula. Seed tuber performed very well in 1st generation than 2nd and 3rd generation.
None.
The author declares no conflict of interest.

© . This is an open access article distributed under the terms of the, which permits unrestricted use, distribution, and build upon your work non-commercially.