Advances in
eISSN: 2373-6402


Sweet potato (Ipomoea batatas (L) Lam) that able to thrive in the tropical harsh condition is one of the vital commodities to small scale farmers. With more than 6,500 wild, traditional and improved varieties globally and the importance of nitrogen (N) fertilization in producing high yield of quality tuber in the tropical region, further research on selected sweet potato varieties and optimum N fertilization was conducted in Field 2 of University Putra Malaysia (UPM) that specifically determining tuber yield and its nutritive quality (carbohydrate, total sugar, and β-carotene) and its selected plant parameters. Five varieties (labeled as A, B, C, D, and E for accessions E10073, E10236, E10136, E10173, and E10051, respectively) at four N application rates (0, 17, 34, and 68 kg ha-1) were used in the 2-factorial experiment with a split plot design. With generally of no N*varieties interaction effect on all parameters, the N rate for optimum yield determined by regression method was 45 kg N ha-1. At this N rate, the resulted high yielder varieties were E and D with estimated yields of 15.1 and 14.5 t ha-1 respectively. The medium yielders were A (13.1 t ha-1) and C (12.7 t ha-1), while the low yielder was B (11.6 t ha-1). The LAI and photosynthetic rate for obtaining higher yield at the N rate were > 1.6 units and > 37 u moles m-2 s-1 respectively. Much higher leaves relative to stem did not cause the Peru originated variety (C) had higher yield than those of the high yielder Malaysian varieties. The high yielder E (E 10051) had carbohydrate, total sugar and β-carotene of 22.4%, 8.3%, 9248 ug g-1, respectively, while the respective values for the medium yielder B (E 10236 ) were 24.1%, 8.0% and 7448 ug g-1. Other varieties had minimal β-carotene of < 16 ug g-1.
Sweet potato (Ipomoea batatas (L) Lam) is a perennial herbaceous dicotyledonous species of the morning glory family Convolvulaceae and is a crop grown as an annual.1 It is ranked as the world’s seventh crop, just after cassava with an annual production of 106 million tons and a cultivated area of 6.6 million ha2. It is a vital commodity to small scale farmers with limited land, labor and capital. Sweet potato is known as a food security crop because of its ability to thrive in the tropical harsh condition and infertile soils, unlike corn or maize.2 The increasing importance of this plant as an economic crop contributing to food security is due to its high spatial and temporal productivity.3 The International Potato Centre (CIP) holds the largest sweet potato gene bank in the world with more than 6,500 wild, traditional and improved varieties.4
Sweet potato serves as a staple food vegetable (fleshy, roots, and tender leaves) snack food, weaning food, animal feed, as well as a raw material for industrial starch and alcohol.5 It is processed into diverse products.6-8 Sweet potato, depending on cultivar is high in carotenoids, particularly, the hydrogen carotenoid the β-carotene.9 Β-carotene is a main source of vitamin A in the roots. The importance of this carotenoid in nutrition and health to developing countries where deficiency of vitamin A remains a serious problem.10 Although sweet potato is invaluable in combating chronic food shortages, the crop could contribute further to dietary micro nutrition in regions of the tropics and subtropics where micronutrient deficiencies are pronounced.11
Nitrogen (N) is an important factor in determining the yield and nutrient composition of root tubers.12 Among the mineral nutrient elements, N most often limits plant growth and yield.13 It is the most essential mineral nutrient for plant growth and development and its proper management is essential in an intensive agriculture for plant production. Nitrogen application was shown to linearly increase dry matter, carotenoid and protein content of sweet potato.12 Villagarcia found that the response of sweet potato to nitrogen fertilizer application depends highly on genotypic and environmental variations.14 Five sweet potato varieties and four levels of nitrogen fertilizer (N) application were therefore evaluated in UPM to compare the yield and nutrient composition of these varieties at its predicted N optimum level that grown under the Malaysian tropical growing condition.
Experimental location
The experiment was conducted at the Agronomy field B, Faculty of Agriculture University Putra Malaysia. It was located at latitude 3⁰ 02'N longitude 101⁰ 42'E with an altitude of 31m above sea level. Total annual rainfall in the year 2011 was approximately 3080 mm with a monthly average of 256 mm. Mean monthly minimum and maximum temperatures were 25 °C and 33 °C respectively while the average monthly relative humidity was 93.4%. The experimental plot was previously sown to elephant grass and the soil is an ex mining area with soil series as alluvial soil with variable textures having high water table. Within the 0-30cm depth, the pH and conductivity 6.18 and 3.16 ds/m respectively, whereas the C, N, P, and K were 1.55%, 0.11%, 1.87ppm and 1.87ppm respectively.
Field culture, experimental design and treatments
The land was ploughed harrowed and rotorvated to a depth of about 15-30 cm prior to planting. Seedlings were from cuttings or apical cuttings of sweet potato plants. They were first planted in polythene black plastic bags and were put under a shade area with 65% to 70% shade. Sufficient watering was done twice a day at 8am in the morning and 4pm in the afternoon. After a month and a half under the shade, the plants were then planted out in the field for two months for further multiplication before the actual field experiment was carried out. The cuttings (apical cuttings) of sweet potato were planted on ridges at a distance of 90 cm between ridges and 30 cm within the ridge. Each main plot size was 13.5 m x 2 m, with the plant density of 37,000/ha. The experimental design used was a split plot replicated 3 times. The main- and sub-plot were N and variety, respectively of the 2-factorial experiment.
The four N application rates were 0, 17, 34, and 68 kg/ha. The five sweet potato verities used were A, B, C, D, and E that corresponded to the accessions of E10073, E10236, E10136, E10173 and E10051 respectively. The E 10051 was collected from Selangor, E 10136 from Peru; E 10173 was collected from Terenganu while E 10236 and E 10073 are from Kedah. The vegetative apical cuttings were planted on ridges at a distance of 90 cm X 30 cm of the inter- X intra-ridge.
Fertilizer application and weeding
Poultry manure 10 t ha-1 was applied two weeks prior to planting. Fertilizer was then applied a month later with the above four rates of N together with standard rates of P and K at 75.5 kg P2O5 ha-1 and 111.6 kg K2O ha-1 respectively. The N, P and K were sources from urea, triple superphosphate and marinate of potash, respectively. Weeding was done manually when required, while plot boarders were maintained by using the herbicide glyphosate at the rate 80 ml per 10 L of water.
Harvesting
Plants were harvested after 3 months of planting. Three plants were harvested from each sub-plot in each replication per treatment. Root were cleaned by using running tap water before drying with all other plant parts in the oven for about 70°C for at least three days until a constant weight were attained. Dry weights for each plant component were weighed using a digital balance (QC 35EDE-S, Sartotius, Germany) and recorded in grams (g). Total plant biomass was summed up from dry weights of all plant components.
Leaf area index (LAI) calculation was made from light interception measurements by LAI-2000 Plant Canopy Analyzer (Li-CoRInc; Lincoln, NE, USA). The LAI-2000 calculates leaf area index and other canopy structure attributes from radiation measurement made with fish eye optical sensor at each plant. Net photosynthesis was measured by using the Portable Photosynthesis Analyzer (Model Li6400, Li-COR) system. The LAI and photosynthesis were recorded between 8 am to 10 am of the day at monthly intervals during the growing stages of the crop.
Nutrient analysis
The proximate analyses of sweet potato were determined by using methods of Association of Official Analytical Chemists (AOAC). Moisture contents of tuber were determined after oven drying at 105°C until constant weight (7 hours). Ash contents were determined after incinerating the dried residue in a muffle furnace at 550°C for 2 hours. Protein contents were determined with micro-Kjeldahl procedure. Crude fat was determined after Soxhlet extraction of dried samples with petroleum ether. Based on data obtained in the above procedures, the determination of moisture, crude protein, crude fat, crude fiber and ash in form of percentages were directly computed. Subsequently, the nitrogen free extract (soluble carbohydrates) was determined by an indirect method in which the percentage of moisture, ash, protein, fiber and fat added together and their sum subtracted from 100% to give the percentage of the free extract.
The samples were cut into small pieces and dried in oven (Astell Scientific model PBS 120D) at 55°C for 24 hrs and ground for the determination of beta–carotene content by using High Pressure Liquid Chromatography Method (HPLC).
Data analysis
Data were analyzed using SAS package (9.2) while treatment means were separated using Least Significance Difference tests among varieties tested, while regression analysis was used to see the selected parameters as affected by N application rates.
Effect of N fertilizer and varieties on yield
The analysis of variance (ANOVA) shows that F values of N, variety, and N*variety on tuber yield were 96.86, 51.82 and 9.99, respectively with the respective p=0.028, 0.063, and 0.912. There was no significant interaction between varieties and N rates in yield, while there was significant effect of N (p<0.05) and variety (p<0.07). This shows that the effect of N on yield was not dependent on varieties tested and vice versa.
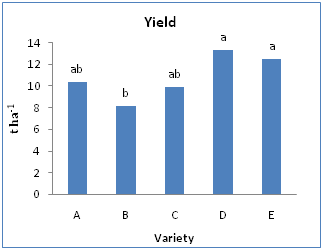
There was a quadratic increase in yield (Figure 1) with increasing levels of N up to 45.5 kg/ha after which at N rate when dy/dN=0, yield declined with further increasing N. The computed yield at 45.5 kg N ha1 was 13.4 t ha-1. Figure 2 shows that the yield of varieties A, B, C, D, and E averaged over N rates were 10.3, 8.1, 9.8, 13.3 and 12.4 t ha-1 respectively.
Effect of N fertilizer and varieties on Photosynthesis

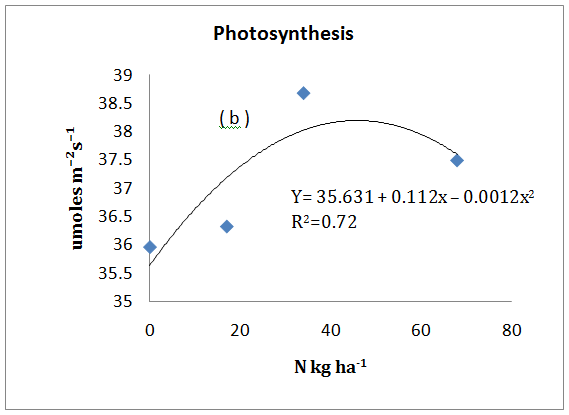
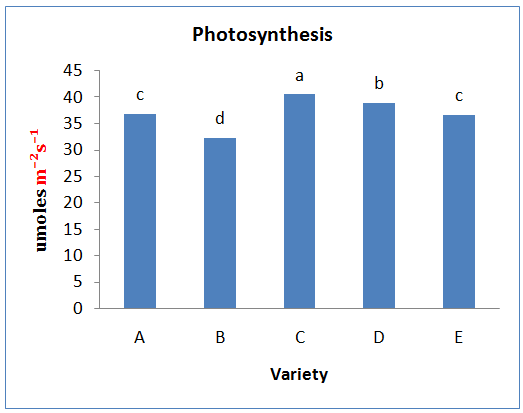
The ANOVA indicates that there was interaction of variety and N (F=9.10; p<0.0001) with significant main effects of variety (F=40.02; p<0.0001) on leaf photosynthesis. The F value for N main effect was 1.51.Due to significant variety*N interaction, each variety had its own quadratic models of photosynthesis vs N rates (Figure 3a). However only Varieties D and E had high R2 values (99% and 98%, respectively as compared to those of varieties A, B and C (<68%). The above regression analyses were based of mean data over replications. Even though without statistical significance at p=0.05, the overall trend had the tendency trend of quadratic function (as based on the means over all replications and varieties) with R2=72% (Figure 3b). The computed N rate at maximum photosynthesis was 46.7 kg N/ha (with photosynthesis of 38.2 u moles m-2 s-1). Due to significant main effect of variety, Figure 4 shows that in overall that Variety C had highest photosynthesis (40.6 u moles m-2 s-1) among varieties. The figures for varieties A, B, D and E were 36.9, 32.4, 38.9, and 36.7 u moles m-2 s-1, respectively. The lowest value for B was also indicated in Figure 3a.
Effect of N fertilizer and varieties on LAI
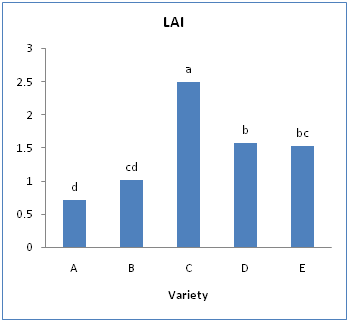
The statistical analysis (ANOVA) had yielded practically non-existence of the N*Variety in affecting leaf area index (LAI) in this study (F=0.40; p=0.9514). The main effect of variety showed significant effect on LAI (F= 13.74; p <0.0001), where as the N rates had significant effect at p=0.13 (F= 2.70; p=0.1384). Figure 5 shows variety C had highest LAI (2.5) then followed by varieties D, E, B, and A (LAI of 1.6, 1.5, 1.0, and 0.7, respectively). Above ANOVA indicates that LAI tended to be different among N rates at higher p level (p=0.13 or 13%). Thus, by independently regressing quadratically of LAI vs N rates, Figure 6 shows that its quadratic function had R2=99%. The computed maximum LAI was 1.6 at 40.3 kg N/ha. This LAI was lower than that highest LAI among variety that averaged among N rates (Figure 6).

Effect of N fertilizer and varieties on stem and petiole dry weight
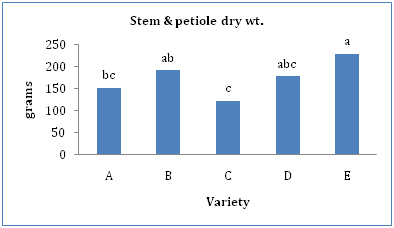
The ANOVA had indicated the F value (and associated p levels) of N, variety, and N*variety interaction were F=0.70(p=0.5880), 3.05(p=0.0309) and 1.30(p=0.2682), respectively with respects to the dry weight per plant of stem plus petioles. The analysis shows only main effect variety had significant effect on stem plus petioles. Variety E had highest weight (227.8 g vine-1) among the varieties tested (Figure 7). The weights for A, B, C and D were 151.3, 190.9, 121.9, and 177.5 g vine-1, respectively. As shown by ANOVA, N rate did not affect the weight, and thus the quadratic equation of mean weight vs N rates had low R2 value (16%) (Figure 8). The range of mean weight over N rate was 143.4 – 197.3 g vine-1.
Effect of N fertilizer and varieties on carbohydrate, total sugar and β-carotene content of sweet potato tuber
Due to tedious and time-consuming process in the lab-related proximate analysis of tuber, the yielded lab data on the carbohydrate, total sugar and β-carotene were those of ‘low’ replicated data for the N x variety treatment combinations. As shown in the above results, i.e., from sufficient replicated data, with the exception of photosynthesis, the ANOVA had indicated non significant interaction of N rates and varieties at p=0.05 on the tuber yield, LAI, and stem plus petioles dry weight. Thus, by assuming in the absence of N x variety interaction, the effect of sweet potato varieties (qualitative variable) on the carbohydrate, total sugar, and β-carotene were statistically analyzed with ANOVA by treating N rates as replications. On the other hands, the effects of N rates (quantitative variable) on the above proximate variables were analyzed with quadratic regression model over five varieties used in this study.
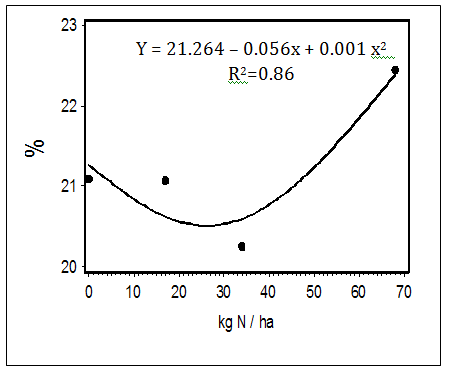
As shown in Figure 9 the carbohydrate content of tuber over all varieties was in quadratic form (R2=86%) with its minimum predicted content (20.5%) occurred at 28 kg N / ha. The range of mean values over N rates was 20.3-22.5%. The predicted values at 0 and 68 kg N/ha were 21.3% and 22.4%, respectively. Figure 10 shows that the carbohydrate contents of A, B and E were not different, that is with the range of 22.8 – 24.5%. The values were higher than those of varieties C and D (16.8-18.4%).
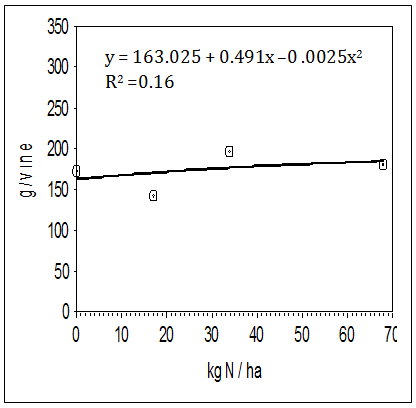

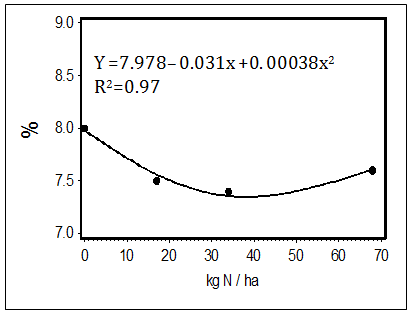
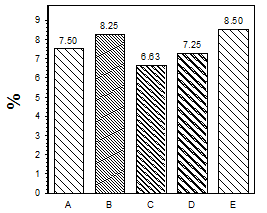
Figure 11 indicates that the quadratic form of tuber total sugar content had similar trend to that of the carbohydrate content. The predicted minimum sugar content (7.3%) was observed at 40.8 kg N/ha. The range of the observed mean values over N rates was 7.4 -8.0%. The predicted values at 0 and 68 kg N/ha were 7.9% and 7.6%, respectively. As tested against varieties, variety E had highest content (8.5%) then those of B, A, D and C (8.2%, 7.5%, 7.3% and 6.6%, respectively) (Figure 12).
As opposed to those of carbohydrate and total sugar content, the β-carotene content of tuber was in the increasing trend of the quadratic form vs N rates with R2= 88% (Figure 13). The predicted mean contents at 0 and 68 kg N/ha were 2,682 and 4653 ug g-1 respectively, while the respective observed values were 2532 and 4703 ug g-1. Figure 14 shows that, when averaged over N rates, variety E has the highest β-carotene (10,505 ug g-1). Variety B had the content of 8,016 ug g-1, whereas A, C, and D had very little amounts (<16ug g-1). The two varieties E and B are orange fleshed varieties as compared to the three which are white fleshed.
Tuber yield were significantly increased by applied nitrogen but not beyond the rate of 45.5 kg N/ha. Thus we recommend that 45 kg N/ha (as predicted by quadratic response that 45.5 kg N/ha gave maximum yield) would be adequate for sweet potato tuber production in the area, depending on background fertility level of soil. As reported by Villargarcia14 the 68 kg N/ha rate produced almost the same shoot dry matter as 34 kg N/ha, and its tuber yield was significantly lower compared to the lower N rate of 34 kg N/ha. High N encouraged luxuriant vine growth at the expense of storage root bulking,
Since older and shaded leaves in the lower parts of the canopy reached their light compensation point and becomes sinks rather than sources of assimilate.15 As affected by varieties, varieties D and E had yields of >12 t/ha. Since the computed maximum yield would be obtained at 45.5 kg N/ha and with non-significant variety*N interaction in affecting yield, the computed yields of A, B, C, D and E ( based on patterns of Figure 1 & 2) at the optimum N application rate were 13.1, 11.6, 12.7, 15.1 and 14.5 t/ha respectively.
The crop attributes of leaf area index and photosynthesis showed quadratic trends versus N rates with their maximums of 1.6 units and 38.2 u moles m-2 s-1 respectively that predicted to occur at respective 40.3 and 46.7 kg N /ha. By examining the varietal effects, varieties C, D and E had LAI >1.5 with highest value (2.5) for C. With similar trends, varieties A, C, D and E had photosynthesis of >35 u moles m-2 s-1 in which C had the highest value (40.6 u moles m-2 s-1). By considering leaf thicknesses are not that different among varieties, higher LAI would indicate higher leaf mass.
Thus, it could be deducted that variety C that originated from Peru that in general, Peru has lower mean temperatures and some parts of areas have semi tropical climate as compared to that of tropical Malaysia ( please check this--- see attached file sourced from internet) it would produce higher vegetative growth and low assimilate partitioning for tuber growth if it is grown under Malaysian tropical growing condition, As based on patterns of Figure 5 & 6, the computed LAI values at optimum N rate for yield ( 45.5 kg N/ha) of A, B, C, D and E were 0.9, 1.2, 2.5, 1.7 and 1.6 respectively. Analytically, by using Figure 3b & 4, the respective predicted photosynthesis of A, B, C, D and E were 38.1, 33.7, 41.6, 39.9 and 37.8 u moles m-2 s-1.
By cross checking with the above yield trend, a reasonably higher yield could be achieved by sweet potato crops with LAI [with the exception of those (Variety C) with more ‘vegetative’ growth] and photosynthesis of > 1.6 units and > 37 u moles m-2 s-1 respectively with application of 45.5 kg N / ha. The attributes of higher growth results from increased nitrogen could be attributed to the effects of nitrogen on cell division and elongation, synthesis of amino acids as well as its impact on some physiological processes favoring growth.11,16 Tsuno & Fujise17 reported that nitrogen increased dry matter and leaf area index of sweet potato and also increased the distribution ratio of above ground to underground parts, while Hay & Walker14 indicated that an increase in nitrogen application rate increased leaf size and longevity as well as branching and leaf area index.
In examining the stem plus petioles (SPP) variety C that originated from Peru had lowest SPP weight as compared to other varieties tested. As discussed above (by taking about similar leaf thickness among varieties) by assuming higher LAI would have higher leaf mass, thus variety C had highest leaves to stem ratio in term of dry weight as compared to those of A, B, D and E. It would suggest that the ‘balanced’ ratios are required in attaining good tuber yield for tropical varieties if grown under Malaysian tropical growing condition. The result of this study shows that the SPP weight was not affected by N if the crop grown under field growing condition, and thus the estimated figure of SPP at 45.5 kg N/ha for each variety was not required. Probably, sweet potato yield is more influenced by leaves rather than stem attribute with respect to N application rates.
The flesh quality of the tuber in this study was made by basing on its contents of carbohydrate, total sugar, and β-carotene. The response curves of carbohydrate and total sugar vs N rates were in the quadratic form with their predicted minimum values of 20.5% (at 28 kg N / ha) and 7.3% (at 40.8 kg N/ha) respectively. The respective computed values at 45.5 kg N/ha (for predicted maximum yield) were 20.8% and 7.4%. Thus, it could be seen that the predicted carbohydrate and total sugar contents at maximum tuber yield were not much different form their respective predicted minimum values. These show that the high tuber yield needs not necessarily had higher carbohydrate and total sugar content. As affected by varieties, varieties that had >20% carbohydrate were A, B and E (23.6%, 24.5%, and 22.8%, respectively), while the respective contents for varieties C and D were 16.8% and 18.4%.
In total sugar content, all Malaysian (tropical) originated varieties had total sugar of >7% (highest being variety E followed by B, A and D i.e. with 8.5%, 8.3%, 7.5%, and 7.3%, respectively). The Peru variety C had only total sugar of 6.6%. The computed carbohydrate content for A, B, C, D and E at optimum N for tuber yield were 23.1%, 24.1%, 16.4%, 17.9% and 22.4% respectively. The respective values for sugar content for the above order of varieties were 7.2%, 8.0%, 6.3%, 6.9%, and 8.3%. Above suggests that among high tuber yielders ( D and E of > 14 t/ha, i.e. computed at 45.5 kg N/ha), variety E had also reasonably high averaged carbohydrate ( 22.8%) and total sugar contents (8.5%), while for D were only 18.4% carbohydrate and 7.3% total sugar. The high carbohydrate and sugar content of the sweet potato makes it a good source of energy.
On examining the β-carotene content, the content increased following the quadratic function over the range of N rates used in this study (R2=0.88). The predicted range of the content over N rates that averaged over varieties was 2532-4703 ug /g. At zero (0 kg N/ha) level of nitrogen fertilizer application, the values of β-carotene of all varieties were low. Increasing application of nitrogen fertilizer increases beta-carotene yield with the highest at 68 kg N/ha. This may indicate that nitrogen stimulate carotenoid biosynthesis, thus agreeing with report of Constantin,12 Hay & Walker 15 that nitrogen increased carotenoid and protein yield in cultivars of sweet potato. The study showed that varieties B and E (8,016 and 10,505 ug g-1, respectively) had markedly higher β-carotene than those of A, C, and D (0, 16 and 15 ug g-1 respectively).
Based on quadratic model (Figure 13) and mean pattern of the contents averaged over N rates (Figure 14) the computed β-carotene for B and E at 45.5 kg N/ha were 7448 and 9248 ug g-1, respectively. It was noted that the varieties that originated from Malaysia (has more tropical climate) had much higher β-carotene than that from Peru when the crops are grown in the Malaysian tropical climate.
The study suggests that the optimum N fertilizer rate for high yield among five sweet potato varieties tested that originated from tropical Malaysia and ‘semi tropical’ Peru were 45 kg N ha-1 when they were grown under Malaysia tropical environment. This tested rate coincided with the computed value generated by quadratic regression analysis of yield vs. N rates (45.5 kg N ha-1). The optimum N rates for LAI and photosynthesis of the plant were also close to the above optimum rate. Based on yield performance, the varieties could be categorized into three classes i.e. high, medium, and low yielders. With the absence of interaction between N and varieties in affecting yield, the estimated yields at optimum N rates of high yielders (Varieties E and D) were 15.1 and 14.5 t ha-1 respectively. The respective yields for medium yielder (Varieties A and C) were 13.1 and 12.7 t ha-1, where as the only low yielder variety B had estimated yield of 11.6 t ha-1.
When grown under Malaysian tropical condition, variety C that originated from Peru ( with some influence of semi tropical climate) with highest LAI ( that led to higher leaves to stem ratio with the assumption of similar leaf thickness among varieties) and photosynthetic rate could not show highest tuber yield among five varieties tested in the study. This suggests that balanced leaves to stem ratio is required in obtaining higher tuber yield in sweet potato cultivation in the Malaysian tropical growing condition. The levels of LAI and photosynthetic rate required for obtaining higher tuber yield at this optimum N rate were > 1.6 units and > 37 u moles m-2 s-1, respectively.
With the inclusion of tuber quality ( with respect to carbohydrate, total sugar, and β-carotene) high yielder variety E (E 10051) that collected from west coast of Peninsular Malaysia ( Selangor) had reasonably high carbohydrate (22.4%) and highest total sugar and β-carotene ( 8.3% and 9248 ug g-1, respectively) when grown at above N optimum rate among five varieties tested. At this N optimum rate, the medium yielder variety B (E 10236 ) that collected from northern Peninsular Malaysia ( Kedah) had second highest β-carotene and total sugar (7448 ug g-1 and 8.0%, respectively) and highest carbohydrate (24.1%) among varieties used in the study. Other varieties (A, C, and D) had minimal level of β-carotene (< 16 ug g-1).
The authors wish to express their gratitude to the Ministry of Agriculture in Fiji in particular the Research Division for permission to carry out the studies and University Putra Malaysia for Funds for the research facilities. Worthy of note also is the support given by Mr Abduli, Mr Fabian both of Institute for Tropical Agriculture University Putra Malaysia, Mr. Suhaimi of Botany Laboratory and the staff of Food Science for their support.
The author declares no conflict of interest.

© . This is an open access article distributed under the terms of the, which permits unrestricted use, distribution, and build upon your work non-commercially.