Correspondence:
Received: January 01, 1970 | Published: ,
Citation: DOI:
Download PDF
Abstract
Purpose: Doppler echocardiography is a sensitive method for diagnosing ventricular septal defect (VSD). In case of bi-directional flow across VSD, we did not identify any study that used velocity time integral to access volume of shunt across VSD during rest/exercise. We identified a case of 28 year old man with bi-directional flow across VSD who presented with unexplained syncopial attacks.
Methods: We carried out an Exercise Stress Echocardiogram using WHO protocol. We used colour doppler across inter-ventricular septum to identify the VSD. Sample volume was then placed through VSD to obtain pulsed doppler images at rest and at peak exercise. We averaged all velocity time integrals (VTI) obtained for five cardiac cycles.
Results: On exercise he managed stage one of the protocol and achieved 75% of maximum predicted target heart rate. His oxygenation dropped from 93% to 74% on air. However, the pulmonary systolic pressure increased from 63mmHg to 104mmHg. The contraction of the right ventricle increased appropriately with exercise. Averaged VTI at rest for left to right (L-R) shunt was 26.32cm and at stress was 21.6cm. Similarly VTI at rest for right to left shunt (R-L) was 78.08cm and at stress was 79.44cm. Absolute change of VTI ratio during exercise was equal to 0.71 (3.67-2.96). This is equal to 24% increase in ratio of VTIs during stress.
Conclusion: According to VTI assessment of bi-directional VSD there was significant worsening of right to left shunt during exercise secondary to increase pulmonary vascular resistance on exercise. This was de-stabilizing his oxygenation and led to syncopial attacks. This case highlights use of Doppler pulsed-wave echocardiography in haemodynamic assessment of bi-directional VSD.
Keywords: Syncope; Stress Echocardiography; Ventricular Septal Defect; Bidirectional Flow; Haemo dynamic Study
Abbreviations
VSD: Ventricular Septal Defect; VTI: Velocity Time Integrals; PISA: Proximal Isovelocity Surface Area; PVOD: Pulmonary Vascular Obstructive Disease; TTE: Transthoracic Echocardiogram
Introduction
Ventricular septal defect (VSD) is a common congenital heart defect in both children and adults [1]. Doppler echocardiography is a sensitive method for diagnosing VSD [2-4]. Various Doppler methods have been used and validated to access haemodynamics of VSDs. These include-pulmonary to systemic flow ratio (Qp:Qs) method [5], time interval from Q wave to onset of shunt method [6], proximal isovelocity surface area (PISA) method [7,8], and 3D echocardiography [9,10]. However, in case of bi-directional flow across VSD, only few studies describe Doppler assessment [6,11].
Pathophysiology
The pathophysiology of isolated VSD depends primarily on the size of the defect and the degree of the pulmonary vascular resistance. Non-significant VSDs tend to have left to right shunts. Left-to-right gradient is maintained so long as the peak right ventricular systolic pressure is <70 mm Hg and the left-to-right gradient is 15-30 mm Hg. From that moment, at the end of the isovolumic phase of relaxation, a small right-to-left gradient appears that is the consequence of a more rapid decrease in the left, compared to the right, ventricular pressure during that phase of the cardiac cycle. This gradient is not accompanied by adequate right-to-left shunting because the change in shunting direction is opposed by the inertia of the blood due to high flow velocity in the left-to-right direction. With a further increase in right ventricular systolic pressure (reaches 60-80% of LV pressure) and pulmonary vascular resistance, the described right-to-left shunting increases and systemic blood de-saturation occurs [12]. This is the hallmark of Eisenmenger syndrome. When systolic pressure in the right ventricle reaches approximately 60% of the left ventricular pressure, right-to-left shunting occurs across the defect during early and mid diastole. However, in patients with Eisenmenger syndrome the right-to-left shunting occurs during late systole with continuation during the early and mid diastolic period. An index of less than 0.5 second (Q-wave on ECG to onset of right-to-left shunt standardized to RR interval; Q-RL/RR) appears to be a useful indicator of the presence of severe pulmonary vascular obstructive disease (PVOD) [6].
We did not identify any study that used velocity time integral to access volume of shunt across VSD and stress versus rest VSD haemodynamics. Hence the aim of our study was to use Velocity Time Integral (VTI) using Pulse Wave Echocardiography to estimate volume of shunt from left to right and right to left both at rest and at stress and appreciate haemodynamic changes to facilitate diagnosis.
Case Report
A 28-year-old man with Down’s syndrome presented to us unexplained exertional syncopial attacks. He was admitted to our unit and monitored on telemetry. His electrocardiogram (ECG) showed tri-fascicular block. He was monitored on telemetry for few days and we did not detect any evidence of complete heart block. His significant past medical history includes: complete atrial-ventricular septal defect, which was repaired in his childhood, pulmonary hypertension and polycythaemia.
Resting transthoracic echocardiogram (TTE) showed moderate right ventricular systolic dysfunction supported by the fact that his TDI of tricuspid annulus was reduced. There was severe RVH. Residual VSD was noted. The flow through the defect is right to left in diastole and left to right in systole. Interventricular septum is compressed mainly in systole, consistent with right-sided pressure overload. Right chambers were dilated.
Methods
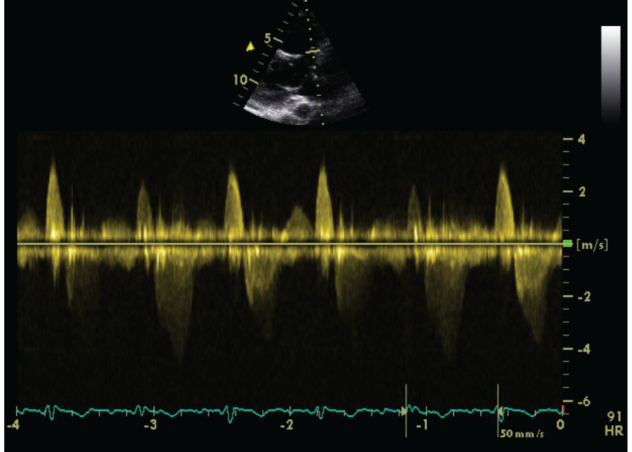
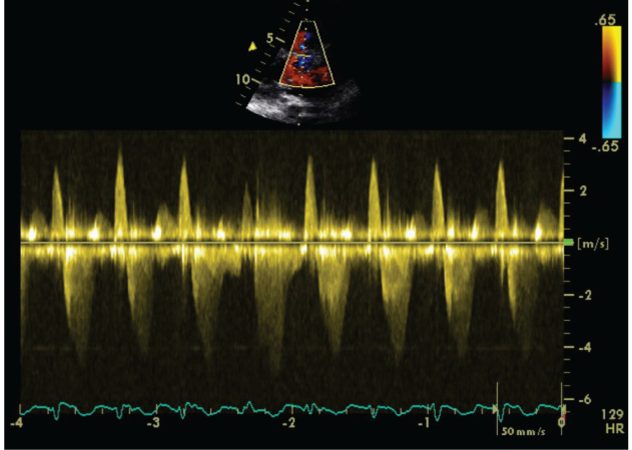
We carried out an Exercise Stress Echocardiogram using a semi-supine bicycle using WHO protocol using a 3-minute step protocol of 20-40 watts at 60-75rpm until volitional fatigue. All basic haemodynamic parameters were recorded at rest and at each stage of exercise (BP, heart rate, Oxygen saturation, electrocardiogram). We assessed his shunt in para-sternal long axis window (PLAX). Consultant cardiologist and senior cardiac physiologist carried out the test. We used colour doppler across interventricular septum to identify the VSD. Once it was identified, we tilted the probe to optimize VSD capture. Sample volume was then placed through VSD to obtain pulsed doppler images at rest (Figure 1). Similar pulsed doppler images were obtained at peak exercise (Figure 2). We did direct shunt volume assessment using velocity time integral (VTI). We averaged all VTIs obtained for five cardiac cycles.
Results
On exercise he managed only stage one at a work load of 25 watts for 2 minutes 26 seconds. We had to slow down because of his breathlessness. His oxygen saturation dropped from 93% to 74% on air. There was no drop in his blood pressure. He achieved 75% (123 beats per minute) of his maximum predicted heart rate (192 beats per minute). However, the pulmonary systolic pressure as estimated from tricuspid regurgitation on echo increased from 63 mm Hg (plus RA pressure) to 104 mm Hg (plus RA pressure). We did not detect any arrhythmia. The contraction of the right ventricle increased appropriately with exercise and this was supported by tissue doppler imaging of the tricuspid annulus.

Figure 1: Echocardiographic Pulse Wave Doppler Signal at rest.

Figure 2: Echocardiographic Pulse Wave Doppler signal at stress.
Vsd Bidirectional Shunt Assessment
Averaged VTI at rest for left to right (L-R) shunt was 26.32cm and at stress was 21.6cm. Similarly VTI at rest for right to left shunt (R-L) was 78.08cm and at stress was 79.44cm.
We calculated rest and stress VTI ratios
toaccess shunt volume dynamics.
r= rest, s=stress
Absolute change of VTI ratio during exercise was equal to 0.71 (3.67-2.96). This means that during exercise, right to left shunt was increasing in volume and left to right shunt was proportionately decreasing.
Limitations of the Study
Pulse-wave Doppler echocardiography is angle dependant and in real-time echocardiography the sample volume angle could have possibly changed across the VSD. Hence, to reduce the error created by this, we averaged our VTI. Also, the sample volume will be influenced be the dynamic angle of the geometrical position and structure of VSD. This has the potential to dynamically alter the peak velocity and the VTI over the cardiac cycle.
Conclusion
We came to the conclusion that this patient’s syncopial attacks are likely secondary to significant pulmonary hypertension worsened by exertion. This is clinically evidenced by drop in oxygen saturation because of increased shunt. This case highlights use of Doppler pulsed echocardiography in assessment of VSD both at rest and exercise. Volume assessment of shunt using VTI has been validated previously [13]. This study builds on clinical application of this methodology. However, we did not use intra-cardiac invasive measurements at rest/stress to justify our findings. Overall, we believe this method should help echocardiographers a technique to access dynamic haemodynamic variation and decompensation on exercise. This can be very helpful like in our case.
References
- Minette MS, Sahn DJ (2006) Ventricular septal defects. Circulation 114: 2190-2197.
- Hatle L, Rokseth R (1981) Noninvasive diagnosis and assessment of ventricular septal defect by Doppler ultrasound. Acta Med Scand suppl 645: 47-56.
- Helmcke F, de Souza A, Nanda NC, Villacosta I, Gatewood R, et al. (1989) Two-dimensional and color Doppler assessment of ventricular septal defect of congenital origin. Am J Cardiol 63(15): 1112-1116.
- Ortiz E, Robinson PJ, Deansfield JE, et al. (1985) Localization of ventricular septal defects by simultaneous display of superimposed color Doppler and cross sectional echocardiographic images. Br Heart J 54(1): 53-60.
- Kurokawa S, Takahashi M, Kato Y, Muramatsu J, Kikawada R (1988) Pulmonary to systemic flow ratios in patients with ventricular septal defect: estimation by transmitral flow velocity. J Cardiol 18(3): 823-836.
- Stojnic B, Pavlovic P, Ponomarev D, Aleksandrov R, Prcovic M (1995) Bidirectional shunt flow across a ventricular septal defect: pulsed Doppler echocardiographic analysis. Pediatr Cardiol 16(1): 6-11.
- Kurotobi S, Sano T, Matsushita T, Takeuchi M, Kogaki S, et al. (1997) Quantitative, non-invasive assessment of ventricular septal defect shunt flow by measuring proximal isovelocity surface area on colour Doppler mapping. Heart 78(3): 305-309.
- Kosecik M, Sagin-Saylam G, Unal N, Kir M, Paytoncu S (2007) Noninvasive assessment of left-to-right shunting in ventricular septal defects by the proximal isovelocity surface area method on Doppler colour flow mapping. Can J Cardiol 23(13): 1049-1053.
- Acar P, Abdel-Massih T, Douste-Blazy MY, Dulac Y, Bonhoeffer P, et al. (2002) Assessment of muscular ventricular septal defect closure by transcatheter or surgical approach: a three-dimensional echocardiographic study. Eur J Echocardiogr 3(3): 185-191.
- Cheng TO, Xie MX, Wang XF, Lu Q (2004) Real-time 3-dimensional echocardiography in assessing atrial and ventricular septal defects: an echocardiographic-surgical correlative study. Am Heart J 148(6): 1091-1095.
- Sommer RJ, Golinko RJ, Ritter SB (1990) Intracardiac shunting in children with ventricular septal defect: evaluation with Doppler color flow mapping. J Am Coll Cardiol 16(6): 1437-1444.
- Levin AR, Spach MS, Canent RV J, Boineau JP, Capp MP, et al. (1967) Intracardiac pressure-flow dynamics in isolated ventricular septal defects. Circulation 35(3): 430-441.
- Zeevi B, Keren G, Sherez J, Berant M, Blieden LC, et al. (1987) Bidirectional flow in congenital ventricular septal defect: a Doppler echocardiographic study. Clin Cardiol 10(3): 143-146.

© . This is an open access article distributed under the terms of the,
which
permits unrestricted use, distribution, and build upon your work non-commercially.


