
Correspondence:
Received: January 01, 1970 | Published: ,
Citation: DOI:
Download PDF
Abstract
This study determined the extent of response and recovery of the aquaculture sector of Guimaras province from the effects of M/T
Solar 1 oil spill. It examined the aquaculture systems, socio-economic status of aquaculture farmers, and productivity of the environment. In this study, only fishponds and seaweed farms in Nueva Valencia and Sibunag were significantly affected by
Solar 1 oil spill. A total of 138 aquaculture farmers consisting of fishpond operators (n=53) and seaweed farmers (n=85) were interviewed. About 68% fishpond operations stopped for a month to four years
because of insufficient fry and fingerling supply, perceived ban on selling of fish, damaged fishpond structures requiring extended repairs, and the presence of oil in the water. Whereas, 71% seaweed farms stopped operating within two months to 2.4 years
mainly because of slow growth.A total of 17 stations were established near inlets where fishponds, fish cages and seaweed farms were located. Results showed that the diversity index (H’) for phytoplankton composition increased from 1.38 to 2.02 whereas, the values of chlorophyll a were variable, ranging from 2.8 to 119 mg L-1
The water quality parameters (e.g., dissolved oxygen, pH and temperatures) were within optimum levels. After 2.6 years from the date of the spill incident, aquaculture farmers did not find any problem with water quality. More (70%) fishpond and seaweed operators were unable to obtain compensation, either their claims were rejected or they refused to accept because payment was perceived to be underestimated. However, half of them indicated that their aquaculture systems have totally recovered from the effects of oil spill and have returned to normal operation.
Keywords: Guimaras; Solar 1 ; Oil spill; Aquaculture
Abbreviations
CFOS: College of Fisheries and Ocean Sciences; CLC: Civil Liability Convention; CNOOC:China National Offshore Oil Corporation; DOC: Days of Culture; GPS: Global Positioning System; Ha: Hectare; IFO: Industrial Fuel Oil; IMO: International Maritime Organization; IOPC: International Oil Pollution Compensation Funds; L: liter; mL: Milliliter; PAHs: Polycyclic Aromatic Hydrocarbons; PCG: Philippine Coast Guard; PHP: Philippine Peso; PPK: parts per thousand; STOPIA: Small Tanker Oil Pollution Indemnification Agreement; UPV: University of the Philippines Visayas
Introduction
The increasing human activities will continue to make the marine environment vulnerable to different types of disasters. Maritime incidents of major concern would be oil pollution (whether accidental or chronic) resulting from the transport of oil, vessel collisions, ship groundings, stress weather, marine operations, and land-based activities. In the light of increasing maritime trades and volumes of shipping traffic, oil spills accidents are also likely to increase [1-3]. The effects of oil on the coastal and marine resources are usually significant as reported in many notable global catastrophic tanker incidents [4-6].
Like many countries in Southeast Asia situated within major maritime routes, the Philippines is always at risk of major disaster due to increasing ocean activities. Although tanker accidents may not be a common occurrence in the country, the grounding of the M/T Solar 1 (998 GT) oil tanker on August 11, 2006 off the waters of Guimaras province was regarded as the first large oil spill accident which shaken the government and general public. The tanker was laden with 2,081 tons of industrial fuel oil (IFO 217) [7], which initially discharged 200,000 L (~196 tons) along the 239-km coastline of Guimaras and some parts of Iloilo province. The incident has spurred a large-scale effort because it posed serious threats to the health of humans, coastal and marine resources. Thus, extensive cleanup operations and scientific monitoring were done to investigate the impacts of oil on the local resources and population. Salvage efforts conducted after seven months to remove any remaining oil revealed that nearly all of the oil on board the Solar 1 had already dissipated [8].
In the study of Andalecio et al. [9], the immediate impacts of oil spill on aquaculture (i.e. fishponds and cages, fishpens, seaweed and oyster farms) were determined by interviewing aquaculture farmers. Although their study failed to concurrently assess the productivity of the culture environment and water source of the affected areas, the responses of aquaculture farmers may be indicative of the environmental condition at the time of the spill. The toxicity of hydrocarbon contamination, specifically, polycyclic aromatic hydrocarbons (PAHs) from Solar 1 oil spill resulted to instantaneous fish kills, low survival, increased input expense, marketing problems, and decreased fish and shellfish demand due to product quality and safety concerns. The effects of PAHs in the waters, sediments and aquatic organisms are also documented in other oil spill incidents [10-13]. Because of poor water quality of the culture environment, some fishpond operators did emergency harvest even when fish sizes were only 91 to 143 g per piece or extended culture period to 6-9 months while others had to stop operating [9]. These situations resulted to decreased fish production yield by 43% to 74%. Higher levels of PAHs were recorded in shellfish collected from the waters of Nueva Valencia a month after the spill [14] and decreased in concentration from September 2006 to November 2008 [15]. In view of these findings and in order to determine the extent of aquaculture response and recovery, a monitoring study has been conducted.
This study examined the aquaculture systems, socio-economic status of aquaculture farmers, and productivity of the environment (through measurement of phytoplankton, chlorophyll a and water quality). Whereas, this study recognizes the complexity and difficulty in quantifying and relating the impacts of oil pollution on phytoplankton, which, according to Banks [16] could have been due to the inherent patchiness, variable zooplankton grazing, and variability in the hydrocarbon composition between spill events and laboratory test comparisons, it considered phytoplankton as an indicator of aquaculture recovery. Because of the economic importance of fisheries and aquaculture and the possibility that the impacts may have medium or long-term effects, assessment of recovery compared pre- and post- oil spill data.
Materials and Methods
Study sites
The province of Guimaras which lies 10o33’36”N and 122o 36’35”E (Figure 1) is composed of a complex marine ecosystem with diverse habitat and species. Its islands are rich in pristine white sand beaches, marine sanctuaries, coral reefs and mangrove forests, making the province one of the most productive fishing grounds in the Philippines [17] and a popular tourist destination. More importantly, it is a home to over 100,000 people who live, farm and fish in its fishing ground. The highly productive waters of Guimaras provide many environmental, economic and societal benefits including livelihood opportunities to a large number of fishing communities. The already threatened coastal resources due to overfishing and habitat degradation have become more susceptible to oil pollution owing to the frequent passage of commercial ships along Guimaras Strait.
The municipalities of Nueva Valencia and Sibunag were chosen as the study sites based on their proximity to the grounding site and the results of the rapid assessment done by Andalecio et al. [9] (Figure 2). An ocular survey of the area was initially done to determine the status of aquaculture facilities and to identify the sampling stations for the plankton surveys. The use of a Garmin 76 Mariner Global Positioning System (GPS)-receiver showed the exact location of aquaculture facilities and plankton survey stations.
Data collection and analysis
Aquaculture production technology and socio-economics: The degree of recovery of the aquaculture sector from
Solar 1 oil spill was determined by interviewing affected aquaculture operators identified in the study of Andalecio et al. [9]. A validated survey instrument consisted of post assessment questions such as the status of aquaculture systems, perceptions of aquaculture farmers to oil spill response mechanisms, level of involvement in recovery, and role of local and national governments in addressing oil spill concerns (
Appendix 1). The primary data were supplemented with secondary information from the municipal and provincial governments, (e.g., maps, statistics), and published and unpublished reports from national government agencies. The interviews were conducted between March 16, 2009 to December 17, 2010 as research funds and personnel were only available during the said dates, and pre-survey preparations were also done. However, not all affected operators were included in the interviews because some aquaculture farms were no longer operating or respondents were unavailable at the time of the surveys.

Figure 1: Philippine map showing the province of Guimaras.
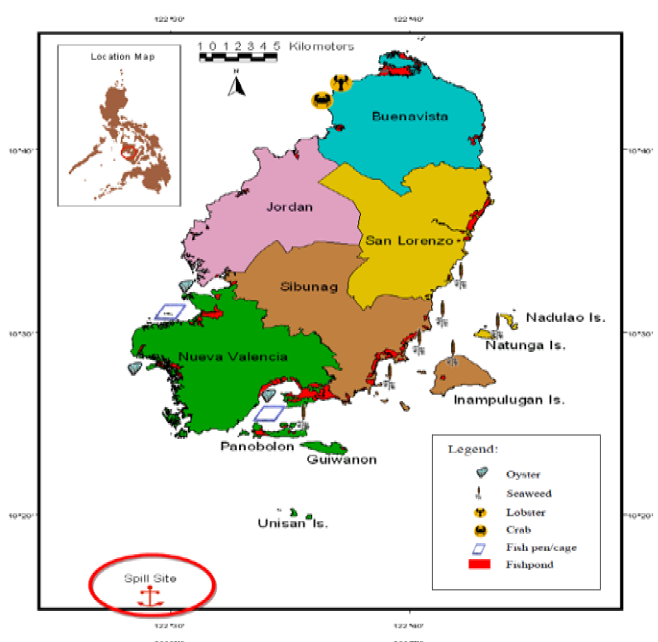
Figure 2: Oil spill grounding site and location of aquaculture facilities.
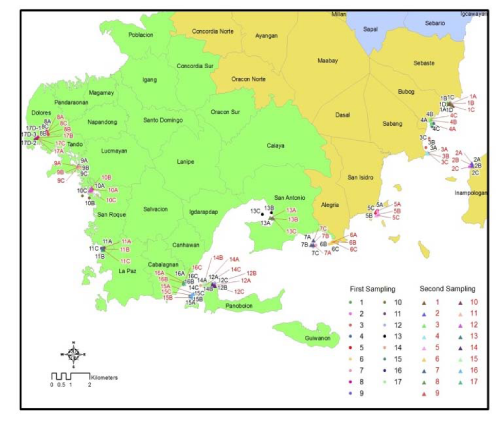
Figure 3: Sampling stations for plankton and water quality surveys.
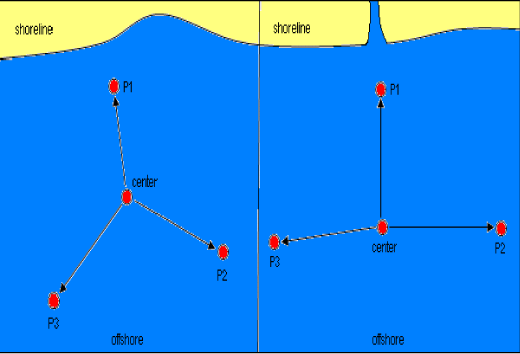
Figure 4: Sample illustration of collection points per station.
Collection and analyses of planktons and chlorophyll a: The productivity of the culture environment and water source was evaluated through determination of phytoplankton composition and chlorophyll a content. The most common measures of phytoplankton abundance are chlorophyll a, primary productivity and direct enumeration. A total of 17 stations were established (Figure 3) in inlets where fishponds, fish cages and seaweed farms were located. Three replicate samples were collected for each station. In every station, four points were established namely, one center point and three collection points (Figure 4). The center point served as the reference point in locating the collection points. The distance from the center to the collection point ranged between 50 to 300 m depending on the area. Each point was marked with a Garmin 76 Mariner Global Positioning System (GPS).
The plankton surveys and water quality measurements were done at two-time periods, namely, April 27-28, 2009 (first sampling) and May 5-6, 2010 (second sampling). The water samples were collected using a 28-mesh-size plankton net with a diameter of 15.24 cm. The plankton net was dragged horizontally at a depth of 0.1 m to 0.25 m and at a distance of about 50 to 300 m per collection point. A 500-mL composite sample was collected in each station using a dipper. The samples were placed in sealed water bottles, properly labeled and stored inside a cooler box containing ice. Then these were brought to the University of the Philippines Visayas (UPV), Marine Biological Station at Taklong Island in Guimaras for immediate filtration in preparation for chlorophyll a analysis following the procedure of Boyd [18]. The samples that were not filtered were preserved in 5% formaldehyde solution. All samples for chlorophyll a analysis were transported to the laboratory of the College of Fisheries and Ocean Sciences (CFOS), UPV, Miagao Iloilo. The chlorophyll a concentration per sample was calculated using the equation [18]:
Chlorophyll a= 11.9 (A665 nm-A750nm) V/L x 1000/s where,
A665 – absorbance at 665 nm
A750 – absorbance at 750 nm
V – Volume of acetone extract in mL
L – Length of light path in the spectrophotometer in cm
S – Volume of samples measured/filtered (mL)
The remaining samples were preserved in 5% formaldehyde for analysis of phytoplankton composition. The phytoplankton species were identified under a NIKON® Bright field microscope equipped with a photomicrograph. Species counts and occurrence were determined using a Neubauer Hemacytometer (BOECO). The phytoplanktons were identified up to the genus or species level. To determine species diversity, the Shannon Wiener Diversity Index (H’) [19] was used and computed as follows:
i=1
Where, H’ is the species diversity index, s is the number of species, and pi is the proportion of individuals of each species belonging to the ith species of the total number of individuals. The higher the value of H’, the greater the diversity indicating that the community is less dominated by a few species.
Measurement of water quality: Water quality was measured concomitant with plankton surveys. For each station, profiles of dissolved oxygen, temperature, pH and salinity were obtained using a portable water quality meter (TPS® WP-91 Waterproof Dissolved Oxygen-pH-mV-Temperature Meter and Aqua-CP Waterproof Conductivity- TDS-pH-Temperature Meter. Also, water depth and transparency were measured with a meter stick and Secchi disk, respectively.
Results and Discussion
Profile of affected aquaculture farmers
In this study, only fishponds and seaweed farms in Nueva Valencia and Sibunag were significantly affected by Solar 1 oil spill. A total of 138 aquaculture farmers consisting of fishpond operators (n=53) and seaweed farmers (n=85) were interviewed. About 64% fishpond operators and caretakers interviewed were married males, with an average age of 49, and educational level up to elementary (38%) and high school (32%). There were more female (52%) than male seaweed farmers. Most were single and the average age was 45, reaching elementary (48%) and high school (34%) education. Respondents were either owners (94%) or relatives of the owners (6%) of seaweed farms. Majority of fishpond operators and seaweeds farmers belonged to local fisheries associations or organizations (e.g., Ilonggo Producers Association, Seaweed Growers Association, Sebaste Baybay Small Fisherfolk Association).
State of Aquaculture Systems Post-Oil Spill: Farming Practices, Production and Environment
Fishpond operations:The total fishpond area surveyed was 444.39 ha, partitioned according to grow-out ponds
, rearing or transition ponds
and nursery ponds
(Table 1). Milkfish (
Chanos chanos) was the main cultured species, either monoculture or polyculture with giant tiger prawn (
Penaeus monodon) or tilapia (
Tilapia spp.). The usual milkfish culture method in Guimaras was extensive, which is dependent on the growth of natural food and constant water exchange. Typically, water change is tide dependent which occurs on a two-week cycle. Fish farmers would usually change water daily in each cycle. With extensive to modified extensive milkfish farms, the stocking density ranges from less than 3,000 to 6,000 fish ha
-1 [20]. In this study, the mean stocking density for milkfish was 4,009 individuals ha
-1. Pond preparation was between one to eight weeks, averaging to about 3.2±2.2 weeks (n=47). Because of the potential effects of oil on the availability of natural food in the culture environment, it would be reasonable to expect that fishpond operators would have changed culture methods. This is because in the marine environment, planktonic organisms may be particularly exposed to oils immediately after spillage and to oil spots floating at the surface for sometime [21]. The mere presence of oil reduces light penetration which inhibits photosynthetic activities of phytoplanktons leading to decreased food availability. Thus, sole reliance on natural food shows a certain degree of risk on the part of aquaculture farmers, and the decision to change from extensive to semi-intensive (with supplemental feeding), or even intensive culture may be rational. However, most (74%) milkfish pond operations in Nueva Valencia and Sibunag remained extensive post-oil spill.
More than half (68%) of the ponds stopped operating for about a month to four year
because of insufficient milkfish fry and fingerling supply, perceived ban on selling of fish, damaged fishpond structures requiring extended repairs, and the presence of oil on the water. Milkfish, giant tiger prawn and tilapia fry and fingerlings were mostly caught from the wild, mainly from the coastal waters of Guimaras and neighboring provinces like Antique, Iloilo and Negros Occidental. The average price of milkfish fry before and after oil spill was PHP0.50±0.30 and PHP0.80±0.53, respectively. Whereas, the average price of giant tiger prawn fry before and after oil spill was PHP1.20±1.20 and PHP1.80±2.20, respectively. The lack of fry supply could have caused the high price difference in milkfish (PHP0.30±0.40) and giant tiger prawn (PHP0.60±0.95) (Figure 5) since fry had to be bought from other places which meant additional transport cost. Over 63% of the respondents (n=49) also observed that fry survival rate was very low.
Prior to oil spill, the mean number of croppings per year for milkfish monoculture was 3.0 in Nueva Valencia and 2.75 in Sibunag [9]. This was reduced to 2.2 at 144 days of culture (DOC) per cropping which indicates that milkfish ponds failed to operate 0.75-1.0 cropping period a year, resulting to economic cost and opportunity lost. The specific DOC and number of croppings per cultured species are shown in Table 2. Reduction in cropping cycles was caused by insufficient fry supply and low survival rate. Fishpond operators were reluctant to harvest and sell fish because of public perception that seafood might be contaminated, and this has affected the fisheries much longer than warranted and far beyond the areas actually contaminated by oil [8].
|
Total Area |
Size Range |
Average size |
Standard Deviation |
Productive |
302 |
0-50 |
6.43 |
9.24 |
Unproductive |
40 |
0-8 |
3.08 |
2.93 |
Grow-out Ponds |
307 |
0-18 |
3.40 |
4.13 |
Transition/Rearing Ponds |
58 |
0-4 |
1.30 |
1.20 |
Nursery Ponds |
60 |
0-4 |
0.72 |
1.02 |
Table 1: Total area (ha) of fish ponds.
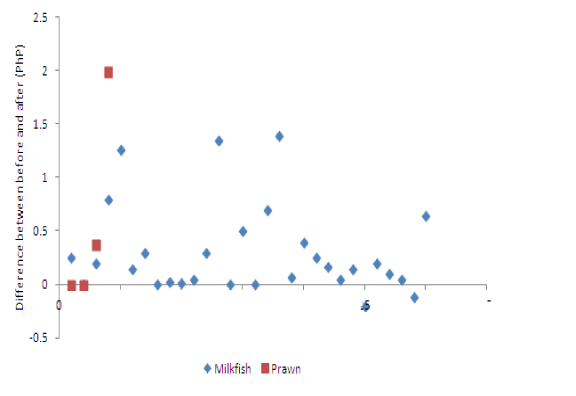
Figure 5: Price (PHP) difference in milkfish and giant tiger prawn fry before and post oil spill.
Species |
N |
Days of Culture (DOC) |
Number of Croppings per annum |
|
Range |
Mean |
Standard Deviation |
Range |
Mean |
Standard Deviation |
Milkfish |
43 |
60-330 |
147 |
51.96 |
1-4 |
2.2 |
0.74 |
Milkfish and giant tiger prawn |
2 |
150-210 |
180 |
42.43 |
2 |
2 |
0.0 |
Milkfish and tilapia |
1 |
105 |
105 |
0.0 |
3 |
3 |
0.0 |
Mudcrab |
1 |
90 |
90 |
0.0 |
3 |
3 |
0.0 |
Giant tiger prawn |
1 |
90 |
90 |
0.0 |
1 |
1 |
0.0 |
Tilapia |
1 |
150 |
150 |
0.0 |
2 |
2 |
0.0 |
Table 2: Post oil spill days of culture (DOC) and number of croppings per annum according to cultured species.
Seaweed farming: Seaweed farms were mostly found in the municipality of Sibunag. The seaweed species commonly cultured was Kappaphycus (locally known as “goso”), and often loosely referred to by the local growers as Eucheuma (for Eucheuma striatum, the old scientific name of Kappaphycus alvarezi). The total seaweed farm area surveyed was 21.21±0.26 ha. Seaweed farming remained small-scale and a family-managed operation. A seaweed farmer was managing 1 to 3 farms, with an average area of 831.63 m2 per farm. The mean water depths during high and low tides were 2.77±1.61 m and 0.14±0.28 m, respectively. Although culture methods remained a combination of fixed off bottom long line and floating long line, some farms shifted to floating long line because it was easy to use and less costly. About 74% of respondents still operated in the same area whereas, others decided to transfer to new areas (about 2.5 kilometers from the original farm site) because of disease occurrence, site accessibility, and space limitation. More (54%) seaweed farmers will expand operation with availability of suitable sites and financial capital. The average number of croppings post oil spill was 4 and 5.3 per year for Nueva Valencia and Sibunag, respectively.
The stocking of seaweeds was throughout the year, but more responses were for the month of August. The average number of croppings per year before oil spill was 4±3.34 but increased to 5±4.74 at 86±49 DOC. About 71% seaweed farms stopped operating within two months to 2.4 years
mainly because of slow growth. Prolonged exposure to chemical pollution, such as the polycyclic aromatic hydrocarbons (PAHs) also kills seaweeds as in the case of most plants and animals. The oil spill incident even intensified the negative effects of ‘
ice ice’ disease, lack of seedlings, slow growth and marketing problem.
Seaweed seedlings were usually sold at PHP10±4.6/kg but the price increased to PHP16.4±5.08/kg after the spill. The average difference of PHP5.81±5.5/kg can also be attributed to increased demand for seedlings with new entrants in the seaweed farming business. At the time of the survey, the price of seedlings was still high at PHP15.65±4.20/kg. The harvested seaweeds were marketed through the seaweed municipal association or private buyers and brought to another province (e.g., Cebu) for processing into other product forms. Only 12% were into contract buying so that they can sell their harvest anywhere and to anyone at a higher price, not being bound to a single or fixed trader. Besides, their membership in a seaweed association guaranteed them assistance in marketing. Seaweeds were mostly sold dried and directly delivered to the buyers.
Most respondents (83%) observed a decrease in the volume of harvest as a result of oil spill. Their last harvest was 1,844±3,488.5 kg (wet weight), of which 82% were sold as dried (98.4%) and 13% used as seedlings. The seaweed farmers’ average monthly income was PHP5, 483.90±7,498.03, and most (75%) indicated that their income decreased by 51% (n=31).
Plankton productivity and water quality: The state of the environment is a major determinant whether an aquaculture system has fully recovered or not. The presence of oil may have reduced the nutrients in the water and light penetration that control phytoplankton growth. However, the decreased productivity of the environment as a result of oil spill may only be short-lived, depending on the persistence of oil. The productivity of the environment can be determined by measuring its chlorophyll
a level. Plants and algae use chlorophyll
a to produce food through photosynthesis [22]. In this study, the values of chlorophyll
a measured along the aquaculture sites were variable, ranging from 2.8 to 119 mg L-1
with increasing trend in 10 stations between sampling periods (Figure 6). This is comparable to the findings of Banks [16] that chlorophyll concentration dropped by 1.13 mg m
-3 in the second week preceding a spill event, but slowly increasing to levels, analogous to pre-spill conditions a month and a half after the event.
The plankton composition was grouped into the following: diatoms, dinoflagellates, blue-green algae, bivalve larvae, eggs, copepods and other unidentified organisms that are part of the flora and fauna of the water (Table 3). Thirteen phytoplankton species were common during the first and second sampling, namely, Navicula sp., Synedra sp., Coscinodiscus sp., Rhizosolenia sp., Biddulphia sp., Fragilaria sp., Amphora sp., Surirella sp., Thallasiosira sp., Nitzschia sp., Triceratium sp., Ceratium furca and Prorocentrum sp. These species belong to major groups such as Bacillariophytes (golden-brown), Cyanophytes (blue-green algae) and Pyrrophytes (dinoflagellates). The diatoms were relatively numerous in most samples, of which Navicula sp. and Synedra sp. occurring most frequently. The frequent occurrence of Navicula sp. may be attributed to the presence of seagrass beds since this species would usually adhere to the seagrass blades or is epiphytic in many filamentous algae. Zooplanktons and copepods were also common. The average diversity index (H’) for all stations has increased from 1.38 (first sampling) to 2.02 (second sampling). Overall, the values of H’ were relatively higher during the second sampling compared to the first sampling (Figure 7). However, the values of H’ were relatively higher in most stations during the second sampling compared to the first sampling especially in stations 1, 5 to 17 (Figures 8-10). Station 7 was the most diverse with H’= 2.68 (Figure 11). This is an indication that water quality conditions have been favorable for the growth of other phytoplankton species.
The water temperatures (28-36oC) and pH levels (7.5-7.7) of the culture environment at both sampling times were within normal range. Even the oxygen level has increased from a mean of 6.7±1.09 ppm to 7.61±0.99 ppm (Figure 12). These environmental conditions are optimum for aquaculture [20, 23-26]. Turbidity refers to the clarity of the water. The higher amount of total suspended solids and phytoplankton in the water would contribute to a higher measure of turbidity. Total dissolved solids and turbidity ranged between 33.0-40.6 ppk and 0.25-2.19 m, respectively. After 2.6 years from the date of the spill incident, over half of the respondents did not find any problem with water quality.
Because chlorophyll a and phytoplankton productivity of the water were measured more than two years after the oil spill, it would be difficult to completely attribute the present state of the environment to the absence of oil. This is similar to the analysis of Varela et al. [27] that it was not possible to determine whether the observed results are a consequence of the effects of oil on phytoplankton or if they fall within the range of ecosystem variability. Two important factors control community structure of phytoplankton namely, physical processes (e.g., mixing of water masses, light, temperature, turbulence, salinity) and associated nutrients [28]. If this is the condition then, Varela et al. [27] recommend a good knowledge of the year-to-year variability of the ecosystem affected by the oil spill using a collection of long data series.
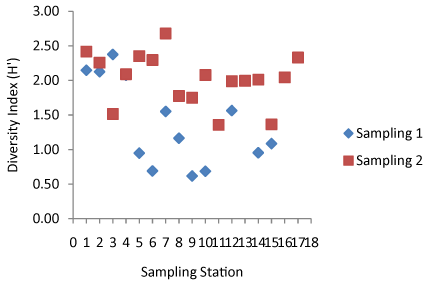
Figure 6: Chlorohyll a concentration during the first (April 27-28, 2009) and second (May 5-6, 2010) sampling.
Diatoms |
Blue Green algae |
Dinoflagellates |
Others |
Amphora sp. |
Oscillatoria sp. |
Ceratium furca |
Tintinnopsis sp. |
Asterionella sp. |
|
Prorocentrum sp. |
bivalve larvae |
Bacteriastrum sp. |
|
Triceratium sp. |
copepoda |
Biddulphia sp. |
|
Protoperidinium sp. |
egg |
Chaetoceros sp. |
|
Peridinium sp. |
nematode |
Compylodiscus sp. |
|
|
unidentified |
Coscinodiscus sp. |
|
|
|
Cocconeis sp. |
|
|
|
Diploneis sp. |
|
|
|
Ditylum sp. |
|
|
|
Fragilaria sp. |
|
|
|
Gyrosigma sp. |
|
|
|
Lauderia sp. |
|
|
|
Licmophora sp. |
|
|
|
Navicula sp. |
|
|
|
Nitzschia sp. |
|
|
|
Pinnularia sp. |
|
|
|
Pleurosigma sp. |
|
|
|
Rhizosolenia sp. |
|
|
|
Stephanophyxis sp. |
|
|
|
Surirella sp. |
|
|
|
Synedra sp. |
|
|
|
Thallasiosira sp. |
|
|
|
Thallasiothrix sp. |
|
|
|
Thallasionema sp. |
|
|
|
Table 3: List of planktons identified in the sampling stations.
Compensation and extent of aquaculture recovery
The Philippines is a party to both the 1992 Civil Liability Convention (CLC) and 1992 Fund Convention created under the International Maritime Organization (IMO). The Solar 1 was entered with the Shipowners’ Mutual Protection and Indemnity Association in Luxembourg (Shipowners’ Club). According to IOPC [29] the limitation amount applicable to Solar 1 in accordance with the 1992 CLC was 4.51 million SDR (£4.3 million), but since the owner was a party to the Small Tanker Oil Pollution Indemnification Agreement 2006 (STOPIA 2006), the compensation was available from the 1992 Fund upon request. Identified economic sectors and individuals affected by the Solar 1 oil spill were paid a total of PHP986, 646, 031 (£14.8 million) in compensation [29].
The payment of compensation for oil pollution damage requires that aquaculture farmers submit a completed application form including supporting documents such as fishpond ownership, receipts of operation, financial statement, etc. Although the Shipowners’ Club and the 1992 Fund received 771 claims from seaweed farmers and fishpond operators, only 198 have been paid totaling to PHP3.3 million [29]. Claims were rejected because the claimants failed to show proof of their involvement in the claimed activities at the time of the incident or that their crops were actually affected by the contamination. In this study, 70% of the respondents were among those who were unable to obtain compensation, either their claims were rejected or they refused to accept because payment was perceived underestimated. A few fishpond operators and seaweed farmers indicated that they received PHP14,422±7,475 (n=16) and PHP10,623±7, 444 (n=26), respectively. Others expressed dismay because despite submission of all required documents, they were not paid for unexplained reasons. Respondents who were also fishers received PHP14, 505±3.65 (n=9) for damaged fishing gears and lost fishing income. With this experience, aquaculture farmers found aquaculture as a low priority sector in terms of oil spill damage compensation.
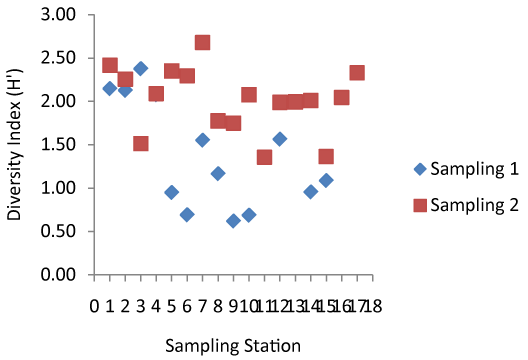
Figure 7: Diversity index (H’) in all stations at two sampling period.
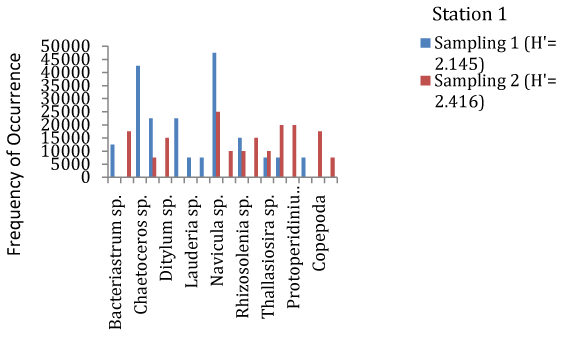
Figure 8: Plankton composition in Station 1 at two sampling period.
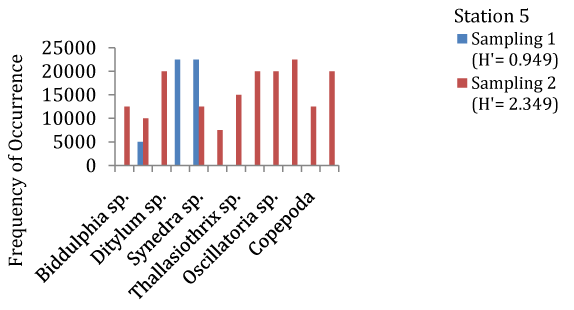
Figure 9: Plankton composition in Station 5 at two sampling period.
Compared to capture fisheries, the aquaculture sector found it difficult to claim for damages without going through legal proceedings (e.g., 29 aquaculture farmers in Tianjin, China versus ConocoPhillips China and the China National Offshore Oil Corporation (CNOOC) [30]). This may also be linked to the very limited studies found in the literature on the effects of oil spill on aquaculture system. Usually, the oil spill effects are associated with fishing when in fact, aquaculture system is more complex than fishing because it requires more knowledge, technology, capital investment and proper management and control. Thus, so as to reasonably compensate the aquaculture sector, it would be useful to consult aquaculture experts (especially local experts). The assessment of aquaculture compensation should not be likened to any business sector as what may have been done in the case of Solar 1 which, according to IOPC [29] that the 1992 Fund’s assessment was a 12-week business interruption period as applied to all similar claims in the area. The fisheries expert guidelines [31] may be a useful tool in assessing aquaculture losses, but it still lacks information distinct to the Philippine aquaculture sector.
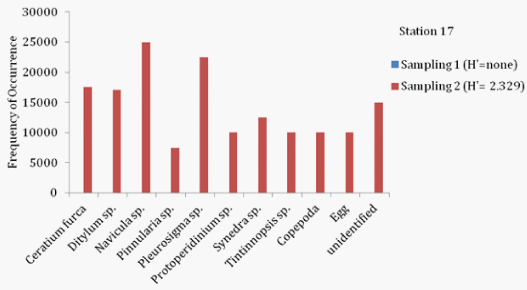
Figure 10: Plankton composition in Station 17 at two sampling period.
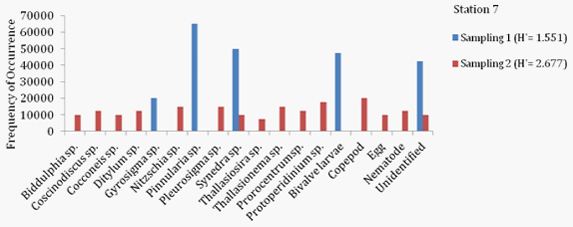
Figure 11: Plankton composition in Station 7 at two sampling period.
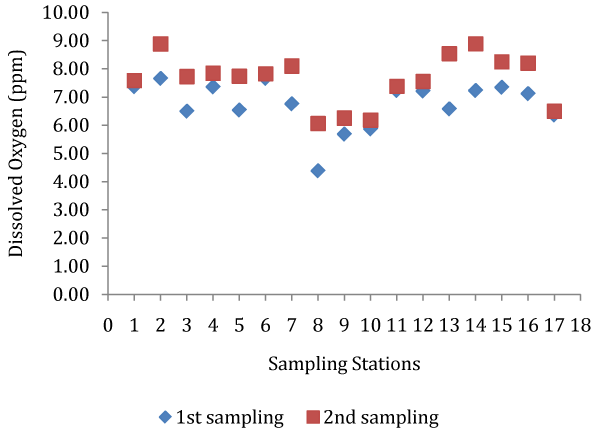
Figure 12: Mean dissolved oxygen levels at two sampling period.
The influence of amplified aquaculture farmers’ reactions to oil spills is however both immediate and long term. Because oil spill accident is uncommon in the area compared to the more regular and predictable storms or typhoons, aquaculture farmers failed to completely protect aquaculture structures. Immediate response included closing the pond gates to prevent water exchange and emergency harvest. The Philippine Coast Guard (PCG) personnel applied dispersants offshore to prevent patches of oil from reaching the shore, but such effort was not viewed effective as oil was still found in culture areas. More aquaculture operations ceased for over a year. Although it may not be economically advantageous to stop operation for an extended period, it can also be beneficial in the long term. Fishponds would have time to rejuvenate, especially with prolonged pond preparation. Instead of the usual 3.4 weeks to a month of pond preparation, it reached up to two months just to ensure that oil was no longer present. There was also sufficient time for seaweed culture sites to return to normal conditions. Continuous flushing of water could have dissipated any oil left thus, improving nutrients and water quality. This was confirmed by the results of the chlorophyll a, phytoplankton assessment, and water quality. Half of the respondents indicated that their aquaculture systems had totally recovered from the effects of oil spill and were back to normal operation (Figure 13), although some still found oil trapped in pond bottoms (Figure 14). Studies on the impacts of major oil spills would show variable results and recovery is typically case specific. Edgar et al. [32] attributed the very little impact on the intertidal and shallow sub tidal zones of the discharged oil during the Jessica oil spill in the Galapagos Archipelago to the paucity of fully sheltered shores in spill path, moderate wave action, warm temperature, high levels of sunlight, and mixing of bunker oil with diesel.
Participation in cleanup operations was found a prerequisite to restore aquaculture operation. Similar to other affected sectors, aquaculture also depended on the government for response and recovery. The local government, national agencies and private institutions provided financial support, relief goods, fingerling supply and alternative livelihood within four months to the third year. Few (n=12) aquaculture farmers even received PHP16,104±6,445 from some private organizations. These forms of assistance were found effective, having supported families’ immediate needs, pond protection and repairs. Many respondents were hired under Petron Corporation’s cash-for-work program for coastal cleanups (PHP200-300 per workday) and construction of spill booms to mitigate further effects of oil.
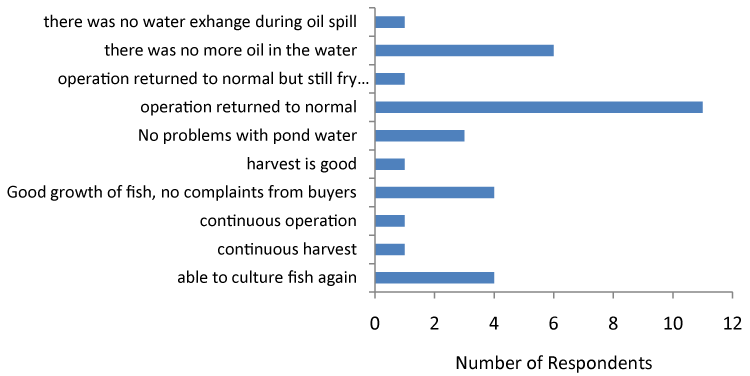
Figure 13: Reasons for the perceived recovery of fishpond operation.
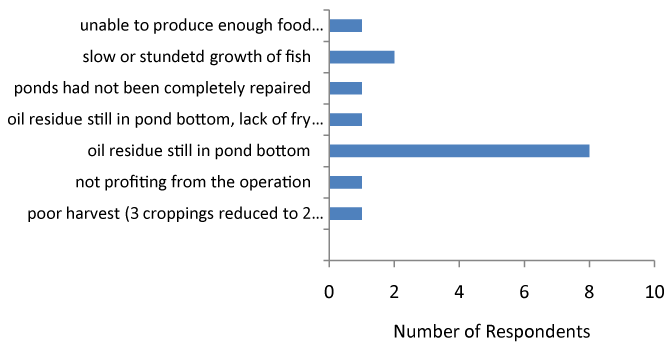
Figure 14: Reasons for incomplete recovery of fishpond operation.
The media could have played a key role on the impacts of oil spill relating to declining prices due to lack of consumer confidence. According to Born et al. [33], declines in prices may represent a general pattern for well-publicized oil spills such as the Braer oil spill in Scotland. Whereas, Alvareza and Loureiroa [34] find that printed media surrounding an oil spill accident have played a significant role in determining fish prices, and thus, amplifying the society’s perception of risk. This stigmatized effect can be incorporated in the calculation of total damages caused by large oil spills on aquaculture and fisheries. In the case of Solar 1 , the stigmatized prices may be considered a short-term concern as some seaweed farmers did not cease operation despite oil spill occurrence.
Based on this study, response and recovery from any disaster could have been instantaneous with increased information dissemination efforts before or during its occurrence. Thus, seminars or workshops on oil spill and related issues were viewed very important and should be done regularly. Compared to the national government, the local government’s response to an oil spill incident was well appreciated by the aquaculture farmers. This may be because the local government was more visible, known in the area, and immediately responded to the needs of aquaculture farmers.
Conclusion
Even as oil spill accidents may have decreased on a global scale, the perceived seriousness or severity for countries that are inexperienced to deal with oil spill cases may be comparable to countries subjected to chronic spills. As an archipelagic country, the Philippines’ marine resources are crucial for the survival of its coastal population. In this study, aquaculture farmers were unprepared to respond to the Solar 1 oil spill as this was a rare incident in the area. The results that insufficient supply and increases in the prices of inputs (e.g., fry, fingerlings and seedlings) were the significant effects of oil spill can be useful information in designing appropriate interventions for aquaculture. Because of the potential impacts of oil spill on aquaculture, there is a need for the sector to be more pro-active in preparing for similar incidents. Basic information which was not available to aquaculture farmers at the time of the incident could now be part of an on-going information and education campaign. The Philippines can learn from countries with long experience in oil spill accidents and have already established risk criteria and assessment protocols [35]. Accidental spills require effective responses to mitigate the immediate and potential long-term impacts on marine ecosystems [3]. An effective response mechanism in a defined geographical area would benefit from an established contingency plan, including information and processes for oil spill containment and cleanup [36]. The extent of the damage and the ease of cleanup depend on how quickly the cleanup response takes effect [37].
Also, aquaculture operation should be completely documented and registered with the municipal and national government (i.e., the Bureau of Fisheries and Aquatic Resources). In the Philippines, aquaculture is covered under the Philippine Crop Insurance Corporation in accordance with Section 54 of Republic Act 8550 (also known as the Philippine Fisheries Code) and Fisheries Administrative Order No. 215, Series of 2001 (i.e., Insurance for aquaculture crops/stocks). However, the coverage is limited to losses caused by force majeure and fortuitous events and does not include human-made disasters like oil spills. It would be useful then if the legal provisions on aquaculture insurance be re-visited in view of new developments. The aquaculture farmers expected that more information be disseminated on pre- and post- disaster which can be readily done at the local level through the assistance of national agencies, academic and research institutions. Aquaculture researches that focus on the socio-economics of production and technology are crucial in establishing pre-spill baseline data.
Acknowledgements
We would like to thank the Oil Spill Response Program (OSRP) of the University of the Philippines Visayas for funding this research. Our deepest gratitude also goes to the local government officials, fishpond operators, seaweed farmers and coastal communities of barangays Alegria, Bubog, Canhawan, Panobolon, Sabang, San Isidro, and Sebaste in the municipalities of Nueva Valencia and Sibunag. We also recognize the invaluable assistance of Mr. Alan Dino Moscoso, Kristal Kae Ombrog, Micah Espia, Louiesa Rose Mayordomo, Erish Estante, Jermaine Lacsamana, Donna Salem, Novie Amar, Jessa Casiano and Marinelle Espino.
References
- Thia Eng C (1999) Marine Pollution Prevention and Management in the East Asian Seas: A Paradigm Shift in Concept, Approach and Methodology. Marine Pollution Bulletin 39(1-12): 80-88.
- Valencia MJ, Kaul HL, Galt J (1983) South China Sea: hypothetical oil spill trajectories and transnational impact. Ocean Management 8(4): 335-351.
- Lee M, Jung JY (2013) Risk assessment and national measure plan for oil and HNS spill accidents near Korea. Mar Pollut Bull 73(1): 339-344.
- Carls MG, Babcock MM, Harris PM, Irvine GV, Cusick JA, et al. (2001) Persistence of oiling in mussel beds after the Exxon Valdez oil spill. Mar Environ Res 51(2): 167-190.
- Le Hir M, Hily C (2002) First observations in a high rocky-shore community after the Erika oil spill (December 1999, Brittany, France). Mar Pollut Bull 44(11): 1243-1252.
- Penela Arenaz M, Bellas J, Vazquez E (2009) Chapter Five: Effects of the Prestige Oil Spill on the Biota of NW Spain: 5 Years of Learning. Adv Mar Biol 56: 365-396.
- Yender R, Stanzel K, Lloyd A (2008) Impacts and response challenges of the tanker Solar 1 oil spill, Guimaras, Philippines: Observations of international advisors. International Oil Spill Conference Proceedings 2008(1): 77-81.
- Yender R, Stanzel K (2011) Chapter 38-Tanker Solar 1 oil spill, Guimaras, Philippines: Impacts and response challenges. Oil Spill Science and Technology 1133-1146.
- Andalecio MN, Yunque NG, Laureta L, Espectato LN, Moscoso AD (2007) Rapid Assessment of the Impacts of Solar 1 Oil Spill on the Aquaculture of Guimaras and Iloilo. (Terminal Report). University of the Philippines Visayas. pp 47.
- MacFarlane GR, Burchett MD (2003) Assessing effects of petroleum oil on intertidal invertebrate communities in Sydney harbour: preparedness pays off. Australasian Journal of Ecotoxicology 9: 29-38.
- Barbour EK, Sabra AH, Shaib HA, Berckley AM, Farajalla NS, et al. (2008) Baseline data of polycyclic aromatic hydrocarbons correlation to size of marine organisms harvested from a war-induced oil spill zone of the Eastern Mediterranean Sea. Mar Pollut Bull 56(4): 770-797.
- Law RJ, Hellou J (1999) Contamination of fish and shellfish following oil spill incidents. Environmental Geosciences 6(2): 90-98.
- Vinas L, Franco MA, Soriano JA, Gonzalez JJ, Ortiz L, et al. (2009) Accumulation trends of petroleum hydrocarbons in commercial shellfish from the Galician coast (NW Spain) affected by the Prestige oil spill. Chemosphere 75(4): 534-541.
- Uno S, Koyama J, Kokushi E, Monteclaro H, Santander S, et al. (2009) Monitoring of PAHs and alkylated PAHs in aquatic organisms after 1 month from Solar I Oil spill off the Coast of Guimaras Island, Philippines. Environ Monit Assess 165(1-4): 501-515.
- Uno S, Kokushi E, Pahila IG, Koyama J (2010) Changings of polycyclic aromatic hydrocarbons in aquatic organisms and sediment at Guimaras after oil spill. Memoirs of the Faculty of Fisheries, Kagoshima University: 63-66.
- Banks S (2003) SeaWiFS satellite monitoring of oil spill impact on primary production in the Galapagos Marine Reserve. Mar Pollut Bull 47(7-8): 325-330.
- Babaran, R. and Ingles, J. (1996) The Coastal Marine Habitats of Guimaras Province: A Rapid Appraisal. Report submitted to the Small Islands Agricultural Support Services Programme (SMISLE). Institute of Marine Fisheries and Oceanology, pp. 191.
- Boyd, C.E. (1979) Water Quality in Warm water Fish Ponds. Alabama Agricultural Experiment Station, Auburn University, Alabama, pp. 359.
- Odum EP (1971) Fundamentals of Ecology,W.B. Saunders Company, Philadephia, pp. 574.
- Sumagaysay Chavoso NS, San Diego McGlone ML (2003) Water quality and holding capacity of intensive and semi-intensive milkfish (Chanos chanos) ponds. Aquaculture 219(1-4): 413-429.
- Vieira LR, Guilhermino L (2012) Multiple stress effects on marine planktonic organisms: Influence of temperature on the toxicity of polycyclic aromatic hydrocarbons to Tetraselmis chuii. Journal of Sea Research 72: 94-98.
- Smith K, Webster L, Bresnan E, Fraser S, Hay S, et al. (2007) A Review of Analytical Methodology Used to Determine Phytoplankton Pigments in the Marine Environment and the Development of an Analytical Method to Determine Uncorrected Chlorophyll a, Corrected Chlorophyll a and Phaeophytin a in Marine Phytoplankton. Fisheries Research Services Internal Report No 03/07. Aberdeen AB11 9DB: 55.
- Bhatnagar A, Devi P (2013) Water quality guidelines for the management of pond fish culture. International Journal of Environmental Sciences 3(6): 1980-2009.
- Sumagaysay NS, Marquez FE, Chiu Chern YN (1991) Evaluation of different supplemental feeds for milkfish (Chanos chanos)reared in brackishwater ponds. Aquaculture 93(2): 177-189.
- DENR (Department of Environment and Natural Resources) (1990) DENR Administrative Order 34: Revised water usage and classification/water quality criteria amending Section Nos. 68 and 69, Chapter III of the 1978 NPCC rules and regulations. Manila: Department of Environment and Natural Resources (accessed December 10, 2014).
- Baluyut EA (1989) Aquaculture Systems and Practices: A Selected Review. ADCP/REP/89/43. Rome: Food and Agriculture Organization of the United Nations.
- Varela M, Bode A, Lorenzo J, Alvarez Ossorio MT, Miranda A, et al. (2006) The effect of the ‘‘Prestige’’ oil spill on the plankton of the N–NW Spanish coast. Mar Pollut Bull 53(5-7): 272-286.
- Alvarez Gongora C, Herrera Silveira JA (2006) Variations of phytoplankton community structure related to water quality trends in a tropical karstic coastal zone. Mar Pollut Bull 52(1): 48-60.
- IOPC (International Oil Pollution Compensation Funds) (2013) Incidents involving the IOPC Funds 2012. Portland House, United Kingdom, pp. 102.
- China org cn (2011) Court accepts oil spill compensation claims. Beijing: China org cn (accessed May 7, 2014).
- IOPC (International Oil Pollution Compensation Funds) (2008) Technical guidelines for assessing fisheries sector claims: With special reference to small-scale operations lacking evidence of earnings. December 2008 Edition (Adopted by the Assembly in June 2007), pp. 39.
- Edgar GJ, Kerrison L, Shepherd SA, Toral-Granda MV (2003) Impacts of the Jessica oil spill on intertidal and shallow subtidal plants and animals. Mar Pollut Bull 47(7-8): 276-283.
- Born AF, Espinoza E, Murillo JC, Nicolaides F, Edgar GJ (2003) Effects of the Jessica oil spill on artisanal fisheries in the Galapagos. Mar Pollut Bull 47(7-8): 319-324.
- Alvareza RD, Loureiroa ML (2013) Environmental accidents and stigmatized fish prices: Evidence from the Prestige oil spill in Galicia. Economia Agraria y Recursos Naturales13(2): 103-126.
- Cunha I, Neuparth T, Moreira S, Santos MM, Reis Henriques MA (2014) Management of contaminated marine marketable resources after oil and HNS spills in Europe. J Environ Manage 135: 36-44.
- Castanedo S, Juanes JA, Medina R, Puente A, Fernandez F, et al. (2009) Oil spill vulnerability assessment integrating physical, biological and socio-economical aspects: Application to the Cantabrian coast (Bay of Biscay, Spain). J Environ Manage 91(1): 149-159.
- Al-Majed AA, Adebayo AR, Hossain ME (2012) A sustainable approach to controlling oil spills. J Environ Manage 113: 213-227.

© . This is an open access article distributed under the terms of the,
which
permits unrestricted use, distribution, and build upon your work non-commercially.


