International Journal of
eISSN: 2573-2838


Research Article Volume 2 Issue 2
1Department of Chemistry, Cairo University, Egypt
2Chemistry Department, King Faisal University, Saudi Arabia
3Ministry of Military Production, Egypt
Correspondence: MM Saleh, Department of Chemistry, Cairo University, Giza, Egypt
Received: January 10, 2017 | Published: March 16, 2017
Citation: Ghonim AM, El-Anadouli BE, Saleh MM. Anodic pretreatment of glassy carbon: impacts on structural and electrochemical characteristics of Niox nanoparticles. Int J Biosen Bioelectron. 2017;2(2):45–53. DOI: 10.15406/ijbsbe.2017.02.00015
Usually, glassy carbon electrode (GC) is used as it is as a substrate for electrochemically deposited nickel or nickel oxide (NiOx) nanoparticles. In the present study, GC carbon is anodically oxidized in different media prior to electrode position of NiOx and the impacts of this pretreatment on the structural and electrochemical characteristics of NiOx are studied. Upon anodic pretreatment of GC electrode in acid (0.1 M H2SO4, GCOX-AC) and in alkali (0.1 M NaOH, GCOX-AL), the structural and electrochemical characterizations of nickel oxide (NiOx) nanoparticles are highly modified. Cyclic voltammetry (CV), scanning electron microscopy (SEM) and energy dispersive X-ray spectroscopy (EDX) are used for characterization of the electrodes. While NiOx nanoparticles deposited on GCOX-AC reveal a bird-like shape, it shows semi-spherical shape when it is deposited on either GC or GCOX-AL, with smaller size on the GCOX-AL. The reversibility of the Ni(OH)2/NiOOH couple increases at both GCOX-AC/NiOx and GCOX-AL/NiOx compared to the untreated case, GC/NiOx. The enhancement in the electrocatalytic properties of both GCOX-AC/NiOx and GCOX-AL/NiOx was tested by glucose oxidation in alkaline solution. Peak current for glucose oxidation on the modified electrodes shows linear behavior according to the trend theoretically depicted by Randles-Sevcik equation for completely irreversible diffusion-controlled process. The enhancement in the catalytic activity of both GCOX-AC/NiOx and GCOX-AL/NiOx is discussed in the light of surface analysis of both electrodes compared to the untreated GC (i.e., GC/NiOx).
Keywords: glassy carbo, oxidized, nickel oxide, nanoparticles, glucose, AC/NiOx, GCOX-AL/NiOx, H2SO4, NaOH, 0.1M H2SO4, 0.1 M NaOH
GC, glassy carbon electrode; NiOx, nickel oxide; CV, cyclic voltammetry; SEM, scanning electron microscopy; EDX, energy dispersive x-ray spectroscopy
Despite the considerable number of articles1-5 dealing with the impacts of electrochemical pretreatment of glassy carbon (GC) electrode on the structural and electrocatalytic activity of deposited catalysts particles, the study of such impacts prior to nickel electrode position considered to be scarce.6 For instance, oxidation of GC is known to enhance its electrocatalytic properties towards many applications such as electrochemical oxidation of many organic molecules.7-10 For instance, oxidation of small organic molecules on an oxidized GC modified with Pt nanoparticles was studied.8-10 They attributed the enhancement of the electro oxidation of such molecules to the increase in the surface area and creation of C-O functional groups on the GC substrate. While the effects of GC pretreatment by anodic oxidation on the electro oxidation of some small organic molecules have been studied,8-10 none has studied such effects on the glucose electrocatalytic oxidation albeit of equal importance. Electrochemical pretreatment of glassy carbon (GC) is performed by anodic oxidation,11,12 cathodic reduction13 or potential cycling.14,15 The above processes took place in different media, e.g., acidic or alkaline electrolytes. Pretreatment of GC by anodic oxidation has been performed in literatures with a consequent surface and structure analysis in the different solutions.16,17 The surface analysis includes the degree of roughness (surface area) and surface concentration of C-O functional groups. In this context and here in this article, we aim to study the impacts of anodic oxidation of GC in acidic and alkaline media on the electrode position of NiOx nanoparticles. Enhancement of the electrocatalytic activity of the different modified electrodes is tested through demonstration of glucose oxidation in alkaline solution.
Nickel and nickel oxide (NiOx) modified electrodes have received continuous and growing attention during the last decades due to their use in many technological applications including: capacitors,18,19 alkaline batteries 20 energy conversion devices21,22 and biosensors.23-25 Usually, preparation of NiOx for electrochemical applications using different techniques is performed on ordinary untreated glassy carbon (GC) electrode. Such techniques include but not limited to: sol-gel preparation of powder NiOx followed by casting26 electrode position27,28 and other techniques.29 The shape and size of the obtained NiOx nanoparticles impose its impacts on the catalytic activity of the oxide.30,31 The electrochemical preparation, in specific, is mostly achieved on glassy carbon electrode. The latter is always pretreated by an ordinary method which is mechanical polishing followed by surface cleaning via sonication. Glucose electro oxidation using transition metal oxides, including both bulk and nanostructures based electrodes, such as NiOx is well documented.32-35 Nickel and nickel hydroxide are known of its excellent electrocatalytic performance in alkaline medium.36,37
Combination of Ni and NiOx with another element such as phosphorus (for an example) has been always aimed to increase the electro activity of electro oxidation of small organic molecules and CO tolerance.38-40 Phosphorous has abundant valence electrons and can affect the electronic states of the studied elements via affecting the electronic states of the main metal (Ni).41 Meanwhile, the presence of the phosphorus atoms may help to adsorb oxygen groups due to the oxophilic nature of the phosphorus.42 This can result in oxidation of the COads to carbon dioxide and hence enhance organic molecules oxidation.43 In this context and in the present work, anodic oxidation of GC electrode may introduce C-O and –OH functional groups which can afford a high tolerance for CO poisoning on the NiOx surface.
In the present work, we study the impacts of anodic pretreatment of GC electrode in H2SO4 and NaOH on the surface and electrochemical and electrocatalytic characteristics of NiOx nanoparticles modified GC electrode (both untreated and pretreated). The catalyst is fabricated electrochemically and is characterized by SEM, EDX and cyclic voltammetry. To the best of our knowledge, and despite the large number of articles regarding the electrode position of nickel oxide nanoparticles on GC, the present article is a first work in studying the effects of the GC anodic pretreatment in both acid and alkaline solutions before the electrode position of important metal oxide such as NiOx. The shape and size and consequently the electrocatalytic activity of the obtained NiOx nanoparticles are dramatically affected by the way of pretreatment of the GC electrode.
All chemicals used in this work were of analytical grade and were purchased from Merck, Sigma Aldrich and they were used as received without further purification. All solutions were prepared using second distilled water. An ordinary cell with a three-electrode configuration was used in this study. A platinum spiral wire and an Ag/AgCl/KCl (sat.) were employed as counter and reference electrodes, respectively. Electrochemical measurements were performed using an EG&G potentiostat (model 273A) operated with E-Chem 270 software. All potentials will be presented with respect to this reference electrode. The working electrode was a glassy carbon (d = 3.0 mm). It was cleaned by mechanical polishing with aqueous slurries of successively finer alumina powder (down to 0.06 μm) then washed thoroughly with second distilled water. Scanning electron microscope (SEM) images were taken using field emission scanning electron microscope, FE-SEM (FEI, QUANTA FEG 250).
GC was oxidized in 0.1 M of H2SO4 (denoted as GCOX-AC) and in 0.1 M of NaOH (denoted as GCOX-AL) at 1.0, 1.5 and 2.0 V for different time periods (60, 120, 300 s). The GC modification with NiOx was achieved as follows: First, the potentiostatic deposition of metallic nickel on the working electrode (i.e., GC or GCOX) from an aqueous solution of 0.1 M acetate buffer solution (ABS, pH = 4.0) containing 1m M Ni(NO3)2•6H2O by applying a constant potential of −1.0 V. Second is the passivation of the metallic Ni in 0.1 M phosphate buffer solution (PBS, pH = 7) by cycling the potential between −0.5 and 1 V for 10 cycles at a scan rate of 200 mV/s.
Prior to each of the above steps (deposition and passivation), the electrode was rinsed in water to get rid of any contaminates from the previous step. The electrode was then activated for 20 cycles in 0.5M NaOH solution in the potential range −0.2 to 0.6 V. The CVs were repeated twice to confirm the reproducibility of the results.
Surface and nanoparticles characterization
Anodic pretreatment of GC electrode was achieved by oxidation at various anodic potentials for different time periods. Figure 1 depicts I-t curves for anodic oxidation of GC electrode in 0.1M H2SO4 (A) and 0.1M NaOH (B) at constant potential of 2V for 60s. The general features of the two curves are similar. The obtained high current at the beginning of the anodic oxidation (either in acidic or alkaline) was attributed to the charging of the double layer. The curves are similar to that obtained in literature for GC electrode.44 The current decreases to minimum values, before it increases again to reach a certain level. The current reaches its saturation higher limit once the water oxidation process is catalyzed to its possible maximum extent corresponds to the activation of the electrode process towards water oxidation.45 The current obtained under oxidation in the acid is higher than that obtained in the alkali. This may be attributed to the greater surface area (more roughness) obtained in case of acid solution compared to that in the alkaline solution (Figures 2C) (Figure 2F). This is in accordance with literatures.16
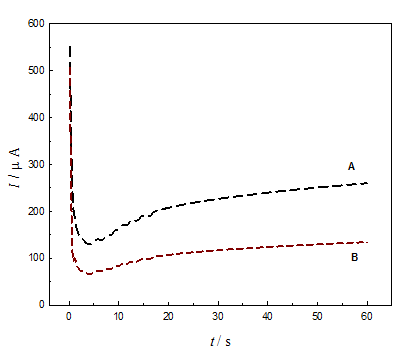
Figure 1 I-t relations for the oxidation of GC at constant anodic potential of 2.0 V in 0.1 M H2SO4 (A) and 0.1 M NaOH (B).
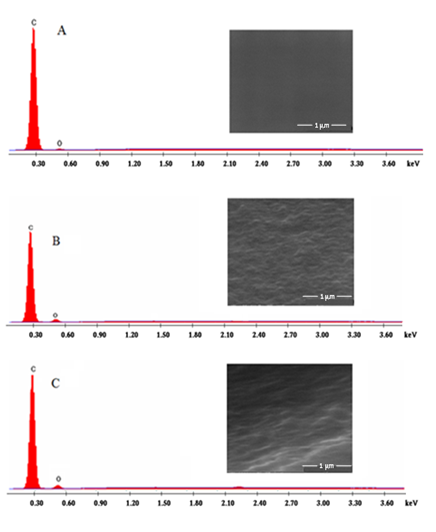
Figure 2 FE-SEM images and EDX charts of GC (A), GCOX-AC (B) and GCOX-AL (C). The GCOX-AC and GCOX-AL were prepared by oxidation of GC at 2 V in 0.1 M H2SO4 or NaOH for 300 s, respectively.
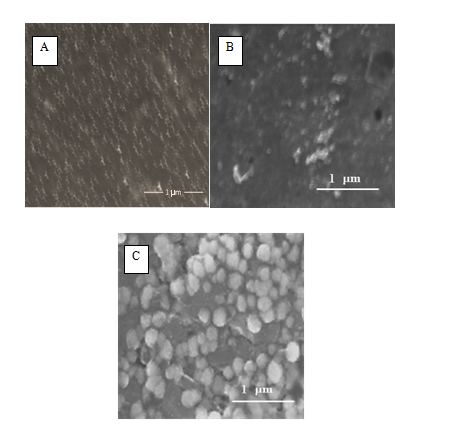
Figure 3 FE-SEM images of GC/NiOx (GC is untreated) (A), GCOX-AC/NiOx (B) and GCOX-AL/NiOx. Before NiOx electro deposition, the GC was oxidized at 2 V for 300 s in 0.1 M H2SO4 (B) and 0.1 M NaOH (C).
Surface characterization was achieved by taking SEM images and EDX charts for the GC and GCox. The SEM images (Figures 2A) (Figure 2C) demonstrate the morphology and EDX charts of glassy carbon surface before (A, GC) and after oxidation of the GC in the acid (B, GCOX-AC) and in alkali (C, GCOX-AL), respectively at 2V for 300 s. The roughness obtained in case of GCOX-AC is relatively higher than that in case of GCOX-AL. This may be attributed to the higher degree of penetration of the acid than of the alkali. This is in accordance with literatures.16 From the EDX charts, the estimated C/O ratio is 97/3, 90/10 and 92.3/7.7 for GC, GCOX-AC and GCOX-AL, respectively. The increase in the O% upon anodic treatment of the GC is attributed to the increase of surface concentration of the C-O functional groups on the GC surface due to surface oxidation. However, the increase in the C/O ratio upon oxidation in the acid is higher than that obtained in the alkaline solution.
Figure 3 presents SEM images of the GC/NiOx (A), GCox-AC/NiOx (B) and GCOX-AL/NiOx (C). These images show the morphology and particle size distribution of the NiOx on the surface of GC before (A) and after (B, C) activation of the surface in the acid and alkali, respectively. Interestingly, the NiOx nanoparticles electrodeposited on GCOX-AC (B) is bearing a bird-like shape with an average dimension of (60 x 550 nm ± 10 nm). The NiOx particles obtained on GC (A) and GCOX-AL (C) have larger average size of 130 and 80 nm (± 10 nm), respectively and have semi-spherical shape.
Impacts on the electrochemical characteristics
Figure 4 shows histograms that demonstrate the time required for electrode position of the same amount of Ni on untreated and pretreated GC electrode. The Ni amount is fixed by using the same amount of electrode position charge, Q (15m C in our case). The GC electrode was pretreated by anodic oxidation at different anodic potentials, E anodic for different time periods, t anodic. This amount of charge and assuming 100% columbic efficiency corresponds to a loading of Ni equal to ~ 0.065 mg cm-2. The figure reveals tdep decreases with the oxidation potential, E anodic and with the time period, t anodic used in the GC oxidation in acid and alkali. The modification of the GC electrode with nanoparticles of NiOx was performed as discussed in the experimental section. As discussed above, three GC electrodes were used glassy carbon without pretreatment (GC), GC after anodic oxidation at specific anodic potential for different time periods in acid (GCOX-AC) or in alkali (GCOX-AL).
The rate of an electrochemical reaction increases with the increase in the electrode surface area and hence the time required for electrode position of the same amount of Ni (charge passed in coulomb) decreases with the increase in the GC surface area (due to anodic pretreatment, see Figures 2). This is clearly revealed from Figure 4. We can easily note that (for an example), 45 s is required to pass the 15m C at GCOX-AC (anodically oxidized at 2V for 300 s), 60 s at GCOX-AL (at the same oxidation conditions) and 240 s is required to pass the same amount of charge on the untreated GC electrode. This was attributed to the higher surface area and higher reactivity of the GCOX–AC and GCOX–AL compared to that of the untreated GC. Note that tdep (at any anodic and anodic) for the GCOX-AC is lower than that of the GCOX-AL which indicates higher activity of the GCOX-AC compared to GCOX-AL. This is consistence with the conclusions driven from the SEM images and the EDX charts in Figure 2.
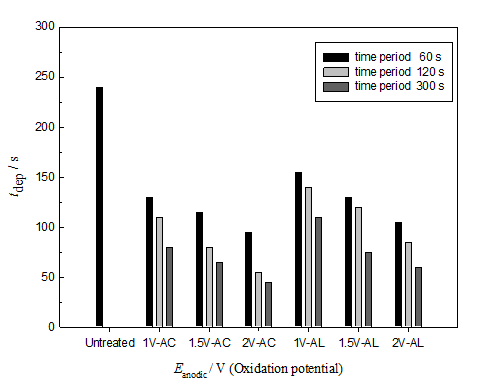
Figure 4 Time required (tdep) for deposition of fixed amount of Ni (Q = 15 mC in all cases) on a pretreated GC by anodic oxidation at different anodic potential, Eanodic in 0.1 M H2SO4 (GCOX-AC: 1V-AC, 1.5V-AC and 2V-AC) and 0.1 M NaOH (GCOX-AL: 1V-AL, 1.5V-AL and 2V-AL) for different time periods (60, 120 and 300 s).
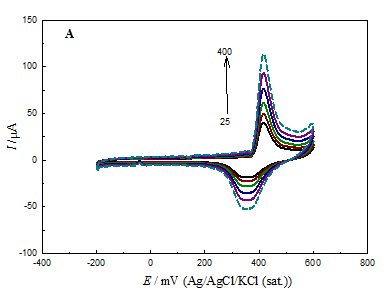
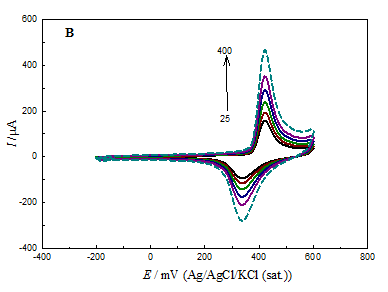
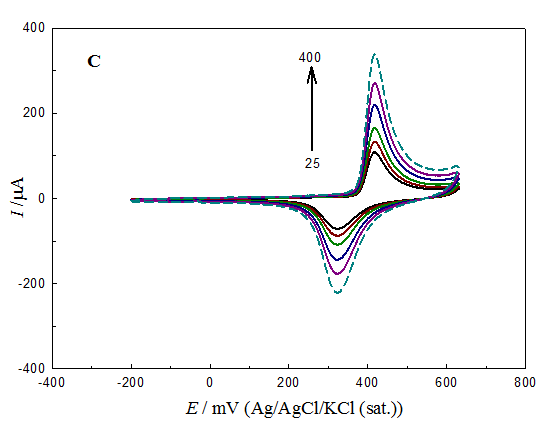
Figure 5 CV responses for GC/NiOx (A), GCOX-AC/NiOx (B) and GCOX-AL/NiOx (C) in 0.5 M NaOH at different scan rates in the range of 25 to 400 mV s-1.
Figure 5 shows characteristics CVs for GC/NiOx (A), GCOX–AC /NiOx (B) and GCOX–AL/NiOx (C) in 0.5M NaOH solution (blank) at different scan rates. For the GCOX-AC and GCOX-AL, the GC was subjected to anodic pretreatment in 0.1M H2SO4 or 0.1M NaOH at 2V for 300 s before nickel deposition. The figure reveals that the peak current for the redox couple (Ni(OH)2 ↔ NiOOH) has the order: GC/NiOx< GCOX–AL/NiOx<GCOX–AC/NiOx for both anodic and cathodic peaks. This increase in the peak current maybe attributed to the modification of the substrate surface structure which gives rise to the enhancement of the NiOx nanoparticles activity. Also, the increase in the surface concentration of C–O functional groups may facilitate the electron transfer for the Ni(OH)2/NiOOH redox couple.
The surface concentration of the active nickel sites, Γ can be estimated using the relation Γ = Q/nF. Note that Q is the charge consumed in the Ni(OH)2/NiOOH process and can be estimated from the area under the CV curve for the above three electrodes. Taking n=1 and F=96500 C/mol, the value of was found to be 6.9, 20.9and 17.4 nmolcm-2 for GC/NiOx, GCOX–AC/NiOx and GCOX–AL/NiOx, respectively. Note that for the last two electrodes, the GC electrode was pretreated by oxidation at 2V for 300s. It is noticed from the above values of Γ that the surface concentration of NiOx species increases in the order GC/NiOx< GCOX–AC/NiOx< GCOX–AC/NiOx. The trend in the value of is consistent with the above recorded CVs. We may conclude that despite the equal amount of loading of NiOx nanoparticles on the electrode surface, the concentration of electrochemical active species depends on the anodic pretreatment method. That is to say, at lower particle size (either in GCOX–AC/NiOx or GCOX–AL/NiOx), there is an increase in the corners, edges and defects on the NiOx surface which results in higher electrochemical activity of NiOx species. The above values of Γ were used to estimate the loading of Ni(OH)2 at the different electrodes (only at the above mentioned conditions) using the relation; [loading (mg cm-2) = Γ x Molar mass of Ni(OH)2x10³]. The estimated loading values using the above method was found to be 6.5x10⁻⁴, 1.95x10⁻³ and 1.62x10⁻³ mg cm-2forGC/NiOx, GCOX–AC/NiOx and GCOX –AL/NiOx, respectively. Further, the utilization percentage, UP can be found according to the relation;
The real loading as given above is 0.065 mg cm2. In this case, UP was estimated to be 1.0, 2.9 and 2.5 % for GC/NiOx, GCOX–AC/NiOx and GCOX–AL/NiOx, respectively which may proof that the redox couple process has a surface nature.
The anodic and cathodic scans for the nickel hydroxide modified electrode are known to produce various phases of the hydroxide namely, β-Ni(OH)2, α-Ni(OH)2, β-NiOOH, and γ-NiOOH.40 It is well known that the formation of γ-NiOOH phase is associated with swelling of the nickel film and consequently, micro cracks and disintegrates may be formed. Therefore, β-NiOOH phase is expected to be a better electro active material for high electrochemical performance in alkaline solution.46 There is also a possibility of preferential formation of β-NiOOH at the GCOX but not on GC. The Ni(II)/Ni(III) conversion occur via a mechanism in which β-NiOOH is likely formed by solvent mechanism in which γ-NiOOH is formed through the diffusion of (Equation 1).47,48
(1)
In the next section we are going to study the impacts of the above findings on the electrocatalytic properties of NiOx towards glucose oxidation in alkaline solution. Similar CVs to that shown in Figures 5A & 5C were collected for GCOX-AC /NiOx and GCOX-AL /NiOx where the GC was anodically pretreated by oxidation at different anodic and anodic prior to NiOx deposition. Analysis of the above collected CVs was performed to extract important electrochemical parameters. Table 1 lists such parameters. These include; the anodic and cathodic peak current of the Ni(OH)2/NiOOH redox couple, IPa and IPc, respectively, ratio of the peak currents (IPc/IPa) and the surface concentration of Ni active sites, As E anodic and/or t anodic increases, the peak current (especially Ipa) increases and the ratio IPc/IPa increases and becomes more closer to unity compared to those of the GC/NiOx. The above results imply that the reactivity and reversibility of the Ni(OH)2/NiOOH redox couple increases upon anodic pretreatment of the GC. Also, the surface concentration, increases with anodic and/or anodic pointing to the increase in the concentration of the Ni active species in the matrix.
Further analysis of the data in Figures 5A & 5C was done by plotting the peak current of both the anodic and cathodic scans with the square root of the scan rate, ν0.5. Figure 6 depicts the Ip-ν0.5 plots for the three electrodes. The plots reveal a straight line which is assigned for a surface confined process. The lines do not pass though the origin maybe due to a non-complete reversibility of the process. Note that the peak potential separation, ΔEp = Epc – Epa in the three electrodes is comparable. The average ΔEp is 75 mV among the three electrodes.
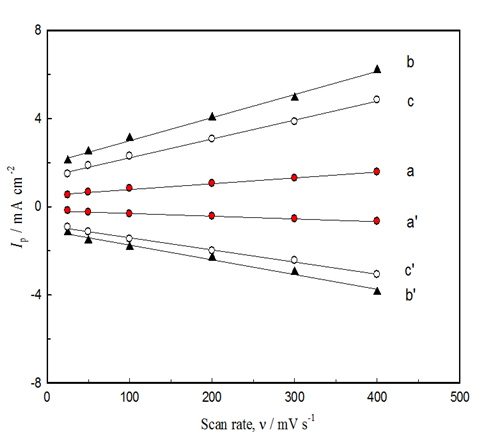
Figure 6 Effect of scan rate on the anodic peak current of the redox Ni(OH)2/NiOOH) for GC/NiOx (GC is untreated) (a, a’), GCOX-AC/NiOx (b, b’) and GCOX-AL/NiOx (c, c’). Before NiOx electrodeposition, the GC was oxidized at 2 V for 300 s in 0.1 M H2SO4 (b) and 0.1 M NaOH (c).
Electrocatalytic activity
Figure 7 shows CV responses for glucose oxidation at the different electrodes from 0.5 M NaOH containing 20 mM glucose solutions at scan rate of 100mVs-1. The electrodes are; a) GC, b) GCOX-AC) GCOX-AL , d) GC/NiOx, e) GCOX-AC /NiOxf) GCOX-AL/NiOx. The last two electrodes (curves e and f) were prepared by anodic pretreatment of GC electrode at 2 V for 300 s in 0.1M H2SO4 and 0.1 M NaOH, respectively. The first three electrodes, ((a) GC, b) GCOX-AC, and c) GCOX-AL) do not show any significant catalytic action towards glucose oxidation. The figure demonstrates that both GCOX-AC/NiOx (curve e) and GCOX-AL/NiOx (curve f) show dramatic increases in the peak current of glucose oxidation compared to GC/NiOx (curve d). A negative shift in the onset potential, Eon set of glucose oxidation is obtained in case of either GCOX-AL/NiOx and GCOX-AL/NiOx. For instance, Eon set of glucose oxidation is 0.30, 0.25 and 0.18 V for GC/NiOx, GCOX-AC /NiOx and GCOX-AL/NiOx, respectively. It points to the faster kinetics of glucose oxidation on the GCOX-AL/NiOx compared to GCOX-AC/NiOx. However, since surface concentration, Γ nickel species in case of GCOX-AC/NiOx is higher than that estimated for GCOX-AL/NiOx, a factor that give rise to higher concentration of NiOOH species which responsible for glucose oxidation according to the following mechanism.
(2)
(3)
That is to say, while anodic oxidation of GC in acidic solution results in an increase in the peak current of glucose oxidation, it affects both peak current and Eon set upon anodic treatment in alkaline solution. The negative shift in Eon set points to the easiness and facilitated oxidation of glucose on GCOX-AL/NiOx. In the other hand the increase in the peak current may be attributed to the GC surface modification and the increase in surface area of the GC.
Similar CVs to that obtained in Figure 7 were measured for glucose oxidation on the different electrodes at different conditions of GC anodic oxidation. The figures were analyzed and important electrochemical parameters are extracted. Table 2 lists the values of peak current, Ip and peak potential, Ep of glucose oxidation at the different electrodes and conditions (different anodic and anodic of GC oxidation). The results point to the enhancement of the glucose electro oxidation upon anodic oxidation of GC in acidic and alkaline solutions. The increase in anodic and/or anodic results in an increase in the peak current of glucose oxidation. The increase in Ip for GCOX-AC /NiOx is more pronounced than that for GCOX-AL /NiOx. However, GCOX-AL /NiOx shows a negative shift in the peak potential for glucose oxidation. This may be attributed to the impacts of the different shape and size of the NiOx nanoparticles as discussed in Figure 2 & Figure 3 (see also Table 1).
The enhancement of glucose oxidation cannot be correlated to a possible different loadings of the NiOx since fixed amount of charge (15 mC) is passed during the Ni electrode position on either GC or GCOX-AC or GCOX-AL at any conditions (see Figure 4) (see also discussion in the previous section). That is to say, the enhancement in the electrocatalytic activity of GCOX-AC/NiOx or GCOX-AL/NiOx towards glucose oxidation was not attributed to different loadings of NiOx but rather to the modification of the GC surface by anodic oxidation and the consequent changes in the shape and size of the NiOx nanoparticles. It is concluded that the enhancement is attributed to the increase in the substrate (GC) surface area which gives rise to a better exposure of the NiOx nanoparticles to glucose oxidation. As revealed from the SEM images in Figure 3, the size of NiOx nanoparticles on GCOx is lower than that deposited on the untreated GC. The decrease in the size of the NiOx nanoparticles is accompanied by an increase in the available corners, edges and defects on the NiOx surfaces which facilitated and hence lead to an increase in the peak current of glucose oxidation. Also, a possible synergism between NiOx and the newly generated C-O functional groups exist. Further possibility is the preferable deposition of active β-NiOOH rather than less active γ-NiOOH.
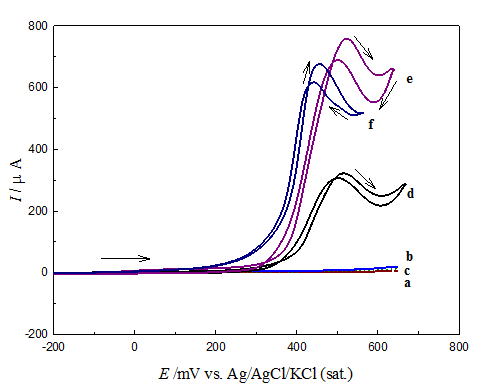
Figure 7 CV responses for glucose oxidation on different electrodes in 0.5 M NaOH containing of 20 mM of glucose solution using scan rate of 100 mV s-1. Electrodes are: GC (a), GCOX-AC (b), GCOX-AL (c), GC/NiOx (d), GCOX-AC/NiOx (e) and GCOX-AL/NiOx (f).
An attempt to correlate the modification that took place on the electrochemical characteristics of the Ni(OH)2/NiOOH redox couple (Table 1) with the enhancement in glucose oxidation (Table 2) can derive us to the following remarks. The enhancement in the glucose oxidation is affected by the increase in the peak current of the Ni2+/Ni3+ couple and the surface concentration of the active Ni species. It rather and to some extent does not depend on the ratio (IPc/Ipa). That is to say, the enhancement depends mainly on the amount of the active Ni species and to little extent on its reversibility. The disappearance of the cathodic peak of the conversion NiOOH→Ni(OH)2 from the cathodic scan (Figure 7) is an evidence of the role of the NiOOH concentration on the oxidation of glucose by what is well known electrocatalytic mechanism.
Figure 8 shows LSV responses of GCOX-AC in 0.5M NaOH containing 20mm glucose at scan range from 25 to 400 mVs-1. The LSV reveal an increase of the peak current of glucose oxidation with a notable positive shift in the peak potential with the scan rate. The disappearance of the reversed scan (cathodic scan) and the positive shift is a characteristic of irreversible voltammetric behavior. The peak current obtained for glucose oxidation after subtracting the background (glucose-free LSV) is proportional to the square root of the scan rate (Figure 9), indicating a typical behavior for a mass transfer controlled reaction. The peak current, Ip of diffusion-controlled totally irreversible process can be given by Randles–Sevcik equation (Equation 4):49
(4)
tanodic/s |
Eanodic/ V |
GCOX-AC/NiOx |
GCOX-AL/NiOx |
||||||
|---|---|---|---|---|---|---|---|---|---|
Ipa/μA |
Ipc /μA |
Ratio Ipc/Ipa |
Γ/ nmol cm-2 |
Ipa/μA |
Ipc /μA |
Ratio Ipc/Ipa |
Γ/ nmol cm-2 |
||
0 |
Untreated |
47 |
22 |
0.46 |
6.9 |
47 |
22 |
0.46 |
6.9 |
60 |
1 |
71 |
33 |
0.473 |
9.6 |
53 |
34 |
0.63 |
9.1 |
1.5 |
78 |
42 |
0.523 |
10.9 |
77 |
49 |
0.646 |
10.4 |
|
2 |
103 |
50 |
0.484 |
12.2 |
86 |
50 |
0.586 |
10.2 |
|
120 |
1 |
84 |
40 |
0.473 |
9.7 |
79 |
48 |
0.6 |
13.7 |
1.5 |
103 |
78 |
0.751 |
15.5 |
95 |
49 |
0.52 |
14.6 |
|
2 |
130 |
79 |
0.606 |
19.7 |
105 |
60 |
0.577 |
12.4 |
|
300 |
1 |
103 |
62 |
0.598 |
16.7 |
106 |
68 |
0.638 |
15.1 |
1.5 |
144 |
109 |
0.758 |
19.7 |
109 |
72 |
0.656 |
14.4 |
|
2 |
192 |
115 |
0.6 |
20.9 |
133 |
87 |
0.654 |
17.4 |
|
Table 1 Electrochemical parameters extracted from CVs for GC/NiOx, GCOX-AC/NiOx and GCOX-AL/NiOx electrodes in 0.5M NaOH (blank). The parameters are: anodic peak current, Ipa, cathodic peak current, Ipc, the ratio (Ipc/ Ipa) and the surface concentration of Ni sites, Γ. The GC was pretreated in different solutions at different anodic potentials, Eanodic and different time periods of anodic oxidation, tanodic
Tanodic / s |
Eanodic / V |
Ip /μA |
Ep/ V |
||
|---|---|---|---|---|---|
0 |
GC/NiOx Untreated |
325 |
325 |
493 |
493 |
Modified Electrodes |
GCOX-AC/NiOx |
GCOX-AL/NiOx |
GCOX-AC/NiOx |
GCOX-AL/NiOx |
|
60 |
1 |
410 |
390 |
537 |
498 |
1.5 |
460 |
405 |
532 |
497 |
|
2 |
485 |
450 |
526 |
458 |
|
120 |
1 |
455 |
430 |
537 |
493 |
1.5 |
560 |
510 |
526 |
492 |
|
2 |
635 |
585 |
531 |
470 |
|
300 |
1 |
485 |
456 |
520 |
485 |
1.5 |
634 |
585 |
526 |
475 |
|
2 |
765 |
680 |
534 |
456 |
|
Table 2 Electrochemical parameters extracted from LSV for glucose oxidation on GC/NiOx, GCOX-AC/NiOx and GCOX-AL/NiOx electrodes in 0.5 M NaOH containing 20mM glucose. These are: peak current, Ip, peak potential, Ep and onset potential, Eonset of glucose oxidation. GC was oxidized at different anodic potential, Eanodic and for different time period, tanodic.
where Ip is the peak current of glucose oxidation, A, n is the total number of electrons (n = 2), α is the charge transfer coefficient (α = 0.59,50) na is the number of electrons in the rate determining step, na = 1, A is the surface area of the working electrode (A = 0.07 cm2), D is the diffusion coefficient of glucose (D = 6.67x10⁻⁶ cm2 s-1,51) C is the bulk concentration of the glucose and v is the scan rate (V s-1). The theoretical plot based on Randles-Sevcik equation is given in Figure 9 (dashed line). It can be concluded that the calculated Randles-Sevcik plot and the experimental data are in qualitative agreement. This indicates a diffusion controlled process.
Enhancement of glucose oxidation either on GCOX-AC /NiOx or GCOX-AL/NiOx compared to GC/NiOx may be discussed here. The enhancement may be attributed to the increase in the substrate (GC) surface area which gives rise to a better exposure of the NiOx nanoparticles to glucose oxidation. As shown in Figure 2 the roughness and hence the surface area of GCOX-AC is higher than that of GCOX-AL. As revealed from the SEM images in Figure 3, the size of the NiOx nanoparticles on either GCOX-AC or GCOX-AL is lower than that deposited on the untreated GC. The decrease in the size of the NiOx nanoparticles is accompanied by an increase in active sites concentration (Table 1) and hence an increase in the peak current of glucose oxidation. As evident from Figure 5 & Table 1, there is an obvious enhancement of the redox Ni(OH)2/NiOOH couple as understood from the higher peak currents, reversibility and increase of the surface concentration of Ni active sites. The enhancement of glucose oxidation follows the enhancement of the Ni(OH)2/NiOOH couple.
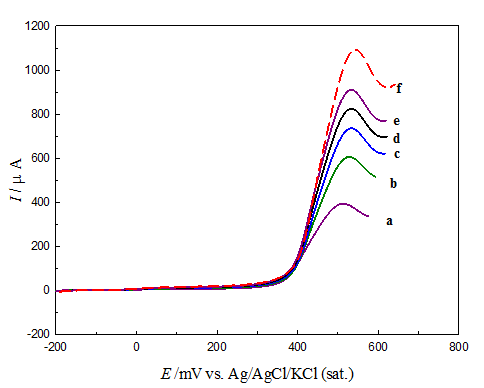
Figure 8 LSV responses for glucose oxidation on GCOX-AC/NiOx from 0.5 M NaOH containing 20 mM glucose. Potential scan rate: (a) 25, (b) 50, (c) 100, (d) 200, (e) 300, (f) 400 mVs-1.
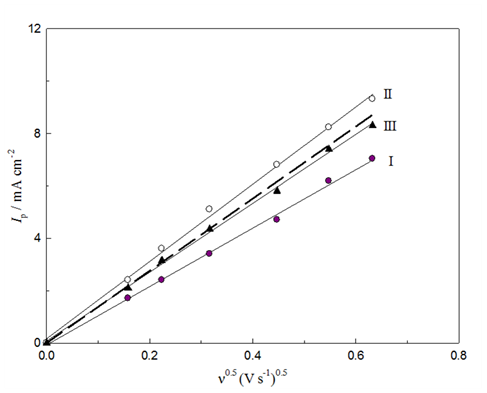
Figure 9 Plots of Ip and ν 0.5for glucose oxidation on GC/NiOx (I), GCOX-AC/NiOx (II) and GCOX-AL/NiOx (III) from 0.5 M NaOH containing 10 mM glucose. Theoretical plot of Randles-Sevick equation is also presented as the dashed line.
According to literature,7,11 XPS study showed that graphitic, phenolic and carboxylic groups are the main functional groups upon anodic pretreatment of the GC. Higher adsorption of glucose on the more hydrophilic surface (GCox) may be offered by such an increase of C-O functional groups. In another remark, while smaller particle size of NiOx obtained on GCOX-AC and higher surface area of GCOX-AC (higher roughness, Figure 2) compared to GCOX-AL implement higher peak currents of glucose oxidation, the adsorbed -OH groups on the GCOX-AL (coming from NaOH during anodic oxidation in the NaOH) maybe the reason of the negative shift in both Ep and Eon set of glucose oxidation on the GCOX-AL/NiOx. The role of adsorbed -OH group in catalyzing the electro oxidation of organic molecules is reported in literatures.52 Our results may be compared with literatures. The activity of our electrodes (either GCOX-AL or GCOX-AC) expressed in mA cm-2 were compared with those in literatures at similar conditions. It was found that it is higher than Ni(OH)2- Zeolite/CPE,53 Ni(OH)2-chitosan/GC,54 GO-NiO/GC,55 NiOx/GC,6 Cu-ZnO/GC56 and it was found to be closer to CuOx/Cu,57 NiOx-MWCNT/G58 and Cu-NPS/GC.59 In the other the activity of the electrode in this work was found to be lower in performance than Ni-NPS/GC60 and NiOx (sol-gel)/GC.26
The results showed significant impacts on the morphology (shape and size) of the NiOx nanoparticles when the substrate (GC electrode) was anodically pretreated at different anodic potentials and at different periods of time. The pretreatment of GC by anodic oxidation has its impact on the redox couple of NiOx, i.e., on the Ni(OH)2/NiOOH. This was attributed to the increase in the GC surface area and in the concentration of C-O functional groups. Glucose electro oxidation is enhanced on either GCOX-AC/NiOx or GCOX-AL/NiOx compared to GC/NiOx. While both GCOX-AC/NiOx and GCOX-AL/NiOx support high Ip of glucose oxidation, GCOX-AL/NiOx shifts the Ep and Eon set to more negative values. The above conclusions were generally discussed in the light of the obtained surface and electrochemical analysis. However, further work has to be done (e.g., XPS study) for further explanation of the above conclusions.
None.
The author declares no conflict of interest.

©2017 Ghonim, et al. This is an open access article distributed under the terms of the, which permits unrestricted use, distribution, and build upon your work non-commercially.