eISSN: 2473-0815


Case Report Volume 4 Issue 4
1Peninsula Physical Health and Nutrition, Australia
2BE Fit Food, Australia
Correspondence: Kate Save, Director of PPN, Peninsula Physical Health and Nutrition, and Co Director of BE FIT FOOD, Accredited Practicing Dietitian and Accredited Exercise Physiologist, Australia
Received: February 21, 2017 | Published: May 8, 2017
Citation: Save K, Padula M, Murray B. The impact of a one week Be-Fit-FoodTM delivered meal program on body composition and blood glucose in type 2 diabetes mellitus patients: preliminary data. Endocrinol Metab Int J. 2017;4(4):107-109. DOI: 10.15406/emij.2017.04.00095
Dietary intake is a key contributing factor in weight management and blood glucose control of Type 2 Diabetes Mellitus (DM). There exists evidence that structured dietary restriction interventions are effective in supporting positive body composition changes and improved glucose control in DM patients. The aim of the current study was to determine the impact of a short-term delivered meal program on changes to body composition and markers of glucose control in established DM patients.
Keywords: be-fit-food, body composition, dm patients, DM, blood glucose, type 2 diabetes mellitus, preliminary data
DM, diabetes mellitus; BFF, be fit food; BM, Body Mass; CI, confidence interval
Patients diagnosed with DM for more than 6 months, and attending a dietetics clinic in the Mornington Peninsula was invited to participate in the study via opportunity sampling. Patients with a history of disordered eating behaviours, presenting with dieting behaviour induced symptoms or relapse, allergies or intolerances for which the BE Fit Food (BFF) meals does not cater and/or who had recently been on a low carbohydrate or ketogenic diet would be excluded from participating in the study. All recruited participants were seen in the dietetics clinic on three different occasions.
An initial assessment was conducted where preliminary measures were taken to determine participant characteristics: height, Baseline body Mass (BM), body composition profile (determined using calibrated electronic scales and multi-frequency bioelectrical impedance analysis (Tanita BC1000, Tanita Australia, Kewdale, Western Australia), waist circumference, and recent (<3 months) HbA1c values. Participants were educated and instructed to record in detail all foods and fluids ingested during the week in a food and fluid diary, including quantities (e.g. g, ml, liters, portions) and qualities (e.g. type of foods-beverages, brands of foods-beverages) ingested for breakfast (pre-stage), lunch, dinner, and snack times. Nutritional information gathered, where applicable, was entered into a dietary analysis software program [Foodworks 8.0 Professional, Xyris, Brisbane, Australia).
Ten DM patients consumed a self-selected diet (SS) for one week followed by a one-week BFF delivered meal program intervention. After recording a week of self-selected diet, participants returned to the dietetics clinic and all measurements taken in the initial assessment were repeated. They were then asked to consume a diet of BFF meals for a week, specifically the Rapid Weight loss program, which was provided to participants. BFF diet is a scientifically formulated meals programme, designed by dietitians and doctors, for rapid weight loss and healthy eating. All meals are calorie controlled and contain low carbohydrate content (<25g carbohydrate per serve) from only wholegrain sources (www.BeFitFoodfood.com.au). During both weeks participants monitored their blood glucose as part of their habitual DM management, and used a continuous glucose monitor (CGM) (Medtronic iPro2, Medtronic Minimed, California, US).
Data in the text and figures are presented as mean values and 95% confidence interval (CI), otherwise specified. Participants presenting incomplete data sets were removed prior to data analysis (n presented in text and figures for each variable). After assumptions of homogeneity were checked, paired sample t-tests or non-parametric equivalent (Wilcoxon) were applied (SPSS v.20, Illinois, US) to determine differences in variables between one week of SS and one week of BFF. The acceptance level of significance was set at p ≤ 0.05. Data from the multi-frequency bioelectrical impedance was used to determine body composition variables. Data from the CGM was analysed through management software for diabetes (CareLink iPro, Medtronic Minimed, California, US) and used to determine fasting, post-meal, daily average, and peak blood glucose concentrations.
Ten participants diagnosed with DM volunteered to participate and were included in the study [mean ± SD (males n = 7, females n = 3): age 47 ± 18 y, height 173 ± 10 cm, BMI 42 ± 11 kg/m2, HbA1c 8 ± 1 %]. A significant difference in daily intakes of total energy (t = 7.489, p = 0.001), total carbohydrate (t = 4.990, t = 0.004), sugars (t = 3.527, p = 0.017), starch (t = 5.266, p = 0.003), total fat (t = 4.791, p = 0.005), saturated fat (t = 4.802, p = 0.005), and monounsaturated fat (t = 4.168, p = 0.009) was observed between one week of SS (i.e., ad libitum food and fluid intake) and one week of BFF (i.e., provided meals only, without inclusion of ad libitum foods and fluids from the permitted extras food list) (Table 1). No difference was observed for daily intakes of total protein (t = 0.804, p = 0.458), polyunsaturated fat (t = 1.527, p = 0.187), and fibre (t = -2.044, p = 0.096).
|
SS |
BFF |
Total Energy |
6008 kJ (5047-6968) ** |
3209 kJ (0-0) |
Total Protein |
75 g (56-95) |
70 g (0-0) |
Total Carbohydrate |
161 g (107-215) ** |
57 g (0-0) |
Sugars |
53 g (38-68) * |
32 g (0-0) |
Starch |
77 g (51-103) ** |
24 g (0-0) |
Fibre |
16 g (11-20) |
19 g (0-0) |
Total Fat |
52 g (37-67) ** |
25 g (0-0) |
Saturated Fat |
21 g (14-28) ** |
7 g (0-0) |
Monounsaturated Fat |
19 g (13-24) ** |
10 g (0-0) |
Polyunsaturated Fat |
7 g (4-11) |
5 g (0-0) |
Table 1 Total energy and macronutrient intake during one week of SS1 and BFF2
Mean and 95% CI (n= 6): ** p< 0.01 and * p< 0.05 vs. BFF. 1 ad libitum food and fluid intake, and 2 provided meals only, without inclusion of ad libitum foods and fluids from the permitted extras food list.
One week of BFF resulted in a significantly greater weight loss (mean (95% CI): -3.3 (-0.1 to -6.2) kg) compared with SS (-0.8 (0.7 to -2.3) kg) (t(6)= 3.2, p= 0.017; n= 7) (Figure 1). However, significant changes between one week of SS and one week of BFF were not observed for body water (43.2 (38.2 to 48.2) % and 43.7 (39.2 to 48.3) %, respectively; Z= 0.1, p= 0.916; n= 6), muscle mass (66.3 (46.7 to 86) kg and 62.1 (47.3 to 76.7) kg, respectively; t(5)= 1.0, p= 0.366; n= 6), body fat (39.6 (31.0 to 47.8) % and 40.9 (28.6 to 52.6) %, respectively; t(5)= -0.5, p= 0.639; n= 6), visceral fat (17.6 (8.1 to 27.1) and 18.2 (4.7 to 31.7), respectively; t(4)= -0.3, p= 0.763; n= 5), and waist circumference (124 (90 to 158) cm and 120 (87 to 153) cm, respectively; t(3)= 2.3, p= 0.108; n= 4).

Figure 1 Body mass change with one week of SS and one week of BFF. Mean (95% CI, lower and upper bound), n= 7: * p < 0.05.
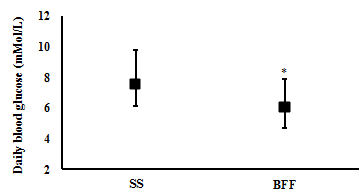
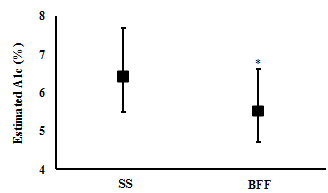
Changes in Blood profile: One week of BFF resulted in significantly lower average daily blood glucose levels (6.1 (4.7 to 7.9) mMol/L and (7.5 (6.1 to 9.8) mMol/L, respectively; t(6)= 3.4, p= 0.015; n= 7) (Figure 2), a significantly lower estimated A1c% (mean (CI): 5.5 (4.7 to 6.6) %) compared with SS (6.4 (5.5 to 7.7) %) (t(6)= 3.7, p= 0.010; n= 7) (Figure 3), and significantly lower daily peak in their blood glucose value (9.9 (8.3 to 12.7) mMol/L and 14.1 (9.0 to 21.5) mMol/L, respectively; t(6)= 2.5, p= 0.045; n= 7) (Figure 4).

Figure 2 Body water after one week of SS and one week of BFF. Mean (95% CI, lower and upper bound), n= 6: * p < 0.05.

Figure 3 Muscle Mass after one week of SS and one week of BFF. Mean (95% CI, lower and upper bound), n= 6: * p < 0.05.

Figure 4 Body fat after one week of SS and one week of BFF. Mean (95% CI, lower and upper bound), n= 6: * p < 0.05.
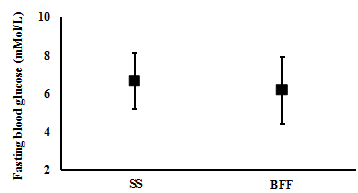
There were no significant differences observed between one week of SS and one week of BFF in the participants blood glucose levels at fasting (mean (CI): 6.6 (5.2 to 8.1) mMol/L and 6.1 (4.4 to 7.9) mMol/L, respectively; t(4)= 1.2, p= 0.302; n= 5) (Figure 5), and postprandial breakfast (9.2 (6.1 to 12.3) mMol/L and 8.3 (5.8 to 10.8) mMol/L, respectively; t(4)= 1.5, p= 0.206; n= 5) (Figure 6). However, BFF resulted in significantly lower blood glucose levels compared with SS post-prandial lunch (7.2 (5.2 to 9.2) mMol/L and 9.3 (7.0 to 11.7) mMol/L, respectively; t(5)= 2.6, p= 0.048, n= 6) (Figure 7), and post-prandial dinner (7.0 (5.6 to 8.3) mMol/L and 9.6 (7.1 to 12.0) mMol/L, respectively; t(5)= 3.6, p= 0.015, n= 6) (Figure 8).

Figure 5 Visceral fat after one week of SS and one week of BFF. Mean (95% CI, lower and upper bound), n= 5: * p < 0.05.
One week of BFF resulted in a greater body mass loss than SS. But no difference in body fat mass and markers of visceral fat were observed.
One week of BFF resulted in lower daily average, daily peak, post-prandial lunch and post-prandial dinner blood glucose levels. However, no difference in fasting and post-prandial breakfast blood glucose was observed between the two weeks.
A significantly lower total daily energy and macronutrient (i.e., carbohydrate and fat) intakes were observed on one week of BFF compared with one week of SS.
None.
The author declares there is no conflict of interest.

©2017 Save, et al. This is an open access article distributed under the terms of the, which permits unrestricted use, distribution, and build upon your work non-commercially.