Advances in
eISSN: 2373-6402


Consumption of food products low in Selenium (Se) such as China, UK, Europe, Australia and New Zealand can result in a population with a lower daily intake of Se. Hence, there is a need to increase the organic Se concentration in food products in Se-deficient regions. Accordingly, controlling the Se uptake, metabolism, and dynamic changes in plants will be important to reaching to adequate methods for biofortification. In this regard, in present study, chlorophyll fluorescence and photosynthetic parameters of old and young leaves of sunflower plants that had been treated by sodium selenite and sodium selenate at different concentrations in nutrient solution, were measured. The results showed that the response of experimented sunflowers at 0.1 and 0.3mg L-1 SeVI concentration, for almost all of the considered parameters was significantly better in comparison with controls samples. It means the application of 0.1 and 0.3mg L-1SeVI enhanced photosynthesis by increasing the photosynthesis rate (Pn) and the transpiration efficiency (E). Also, Se treatment enhanced the activity of the photosynthetic system by increasing Fv/Fm and Fv/Fo. Then, present study proves the chlorophyll fluorescence or photosynthetic parameters can be used for determining the sufficiency of Se treatment during the production of sunflower by Se.
Keywords: sodium selenite, sodium selenate, photosynthesis, sunflower
Chl, chlorophyll; PS, photosynthetic system; E, transpiration rate; Fm, maximal fluorescence yield of the dark-adapted state; F0, minimal fluorescence yield of the dark-adapted state; Fv/Fm, maximal quantum yield of PSII photochemistry; Fv/F0, potential photosynthetic capacity; Fv, Variable fluorescence; Pn, photosynthesis rate
Trace selenium (Se) determination in environmental and food samples is of great importance, because of playing an important role in biologic and physiologic body functions (as an essential nutrient) for humans, animals, microorganisms, and has also been found to plants.
The chemical properties of Se are relatively similar to those of sulphur. Its speciation is highly dependent on the pH and Eh1,2 inducing a complex behaviour and a large variety of selenium compounds in the environment. Se has four stable redox states: selenide (Se (-II)), elemental selenium (Se (0)), selenite (Se (IV)) and selenate (Se (VI)).3,4
As an essential trace mineral, Se is indispensable for cells to function properly. Two inorganic species, selenite (SeIV) and selenate (SeVI) are important in biogeological and biochemical cycle of Se, but they exhibit different biochemical properties and their energy consumption during uptake and metabolism are different.5,6
Se is characterized by its relatively narrow concentration range resulting in deficiency, essentiality and toxicity.7 Furthermore, selenium levels in the environmental and food samples are generally lower than detection limits of the conventional techniques reported for its determination.8 To counteract this problem, many studies demonstrated that proper doses of Se compounds can use to increase the Se content in the edible parts of crops,9–11 hence in this study we selected sunflower (Helianthus annuus L.) because it is widely used plants cultured throughout the world, is important sources of Se for human diet.12
In addition, leaves contain various pigments (chlorophylls and carotenoids) that have the property to absorb light energy. This energy can be used for photosynthesis (photochemistry) or re-emitted as light-chlorophyll fluorescence13 by measuring the chlorophyll fluorescence, information about changes in the efficiency of photochemistry is gained.14 Fluorescence can be quantified by exposing a leaf to light of defined wavelength and measuring the amount of light re-emitted at longer wavelengths.15,16 In recent years, the technique of Chlorophyll fluorescence (Chl-fluorescence) has become ubiquitous in plant ecophysiology studies. Variable fluorescence was found to be a very sensitive tool, giving early indications of the general indications of the photosynthetic apparatus. The use of this simple technique reports directly on the photochemical activity of chloroplasts17 and photosynthesis is one of the primary metabolic processes that determines crop production and lower photosynthetic activity includes decreased photochemical efficiency of photosynthetic system II (PSII)18 which represents the most vulnerable complex of the photosynthesis apparatus19 and until now influence of Se on chlorophyll fluorescence and relationship between the tissue Se concentration and photosynthetic system in producing Se-rich sunflower has not been reported. Therefore, in this work we tried to expose sunflower plants to Se in both forms of sodium selenite and sodium selenate and investigate so-called issues.
Materials
Sodium selenite and sodium selenate were obtained from Sigma-Aldrich Ltd. (Poole, UK).
General plant propagation
Sunflower (Helianthus annuus L. cv. Arena PR) as a dicotyledons plant was chosen for our research. Disinfected sunflower seeds were geotropically germinated between moist filter papers in 22°C. Sunflower seedlings with 1.5-2.0cm hypocotyl were placed into aerated nutrient solution pots. Sunflower plants were grown up in a climate room under strictly regulated environmental conditions. Relative humidity was maintained between 65-75%, light/dark cycle was 16/8 hrs with a respective 25/20°C temperature periodicity, and light intensity was kept in constant 300μmol m-2s-1 during daytime.
Plant growth in nutrient solution
The nutrient solution that was used for plant growth had the following composition: 2.0mM Ca(NO3)2, 0.7mM K2SO4, 0.5 mM MgSO4, 0.1mM KH2PO4, 0.1mM KCl, 10µM H3BO3, 0.5µM MnSO4, 0.5µM ZnSO4 and 0.2µM CuSO4. Iron was supplied in the form of 10-4 M Fe-EDTA, too.20
Selenium was supplemented to the nutrient solution as two species of selenite in form of Na2SeO3 and selenate in form of Na2SeO4 in five different concentrations as follows: 0 (control), 0.1, 0.3, 0.9, and 3mg L-1. Nutrient solution was changed every 3days and evaporated water was replenished regularly. The experiment ended 3 weeks after planting when third leaf of control treatment grew completely and seedlings had approximately 30-20cm long shoots and roots, respectively. Experiments were carried out in triplicates (three pots), where every pot had four seedlings.
Chlorophyll florescence parameters measurement
The Chlorophyll fluorescence was determined on dark-adapted leaves (20min of dark adaptation) by attaching light exclusion clips to the central region of each sunflower leaf, and the chlorophyll fluorescence parameters were measured by a portable chlorophyll fluorometer-PAM-2100 (WALZ, Germany). The fluorescence parameters recorded include the minimal fluorescence (Fo) when all PSII centres are open (open state) and increases with a maximum (Fm) when PSII centres are closed (closed state), the variable fluorescence (Fv), the potential photosynthetic capacity (Fv/Fo) which reflects the efficiency of electron donation to PSII and the ratio (Fm–Fo)/Fm that also known as Fv/Fmwhich is calculated from fluorescence values Fo and Fm. The Fv/Fmratio is one of the most common parameters used in fluorescence that reflects the capacity to trap electron by the PSII reaction centre.
In this study all of the fluorescence parameters, including Fo, Fv, Fm, Fv/Fmand Fv/Fo of older and younger sunflower leaves were determined.
Photosynthetic parameters measurement
The photosynthetic rate was determined using a Cl-340 handheld photosynthesis system (ClD Company, Camas, USA). The system was operated under open system measurement and light attachment (PAR-1200). The net photosynthesis rates (Pn) and transpiration rate (E) of older and younger sunflower leaves were determined.
Statistical analyses
All data were statistically analyzed using SPSS 17.0 software, and the mean values of each treatment group were subjected to multiple comparisons analysis using the One-Way ANOVA and a significance level of p<0.05.
The bars indicate the standard error of the mean. Significant differences in the mean value of each treatment group are indicated by different lowercase letters based on the LSD test (p<0.05, n=3) when the data were homogenous and Games-Howell test (p<0.05, n=3) when the data were not homogenous.
SeIV uptake effects on chlorophyll florescence parameters of sunflower’s old and young leaves
Figure 1 displays Fo, Fv and Fm values at different concentrations of SeIV that was not seen any significant difference between these chlorophyll florescence parameters.

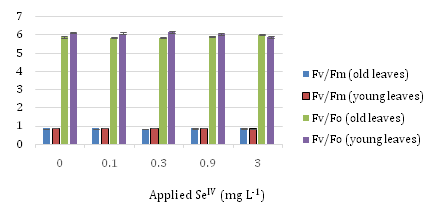
Figure 2 displays (Fv/Fm) and (Fv/Fo) values at different concentrations of SeIV that was not seen any significant difference between these chlorophyll florescence parameters.
SeVI uptake effects on chlorophyll florescence parameters of sunflower’s old and young leaves
Figure 3 displays Fo, Fv and Fm values at different concentrations of SeVI. About Fo there is no significant difference but control in both Fv and Fm has the most amount and diminish process in 0.9 and 3 SeVI mg L-1is obvious.
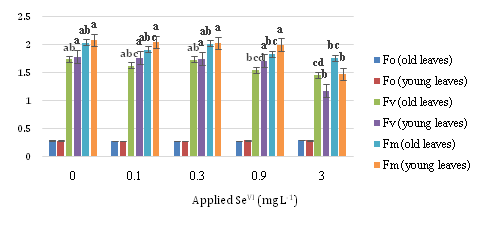
Figure 4 displays (Fv/Fm) and (Fv/Fo) values at different concentrations of SeVI. 0.3 mg L-1SeVI and 0.1 mg L-1in both Fv/Fm and Fv/Fo has the most amount in old and young leaves respectively and diminish process in 0.9 and 3 mg L-1SeVI is obvious.

SeIV uptake effects on Photosynthetic parameters of sunflower’s old and young leaves
Figure 5 displays Pn and E values at different concentrations of SeIV. 0.1 mg L-1SeIV in both Pn and E has the most amounts and diminish process in 0.9 and 3 mg L-1SeIV is obvious.
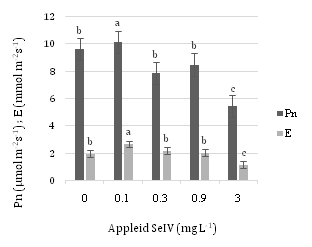
Figure 6 displays Pn and E values at different concentrations of SeIV. 0.3 mg L-1SeIV in Pn and 0.1 mg L-1SeIV in E has the most amount and diminish process in 0.9 and 3 mg L-1SeIV is obvious.
SeVI uptake effects on Photosynthetic parameters of sunflower’s old and young leaves
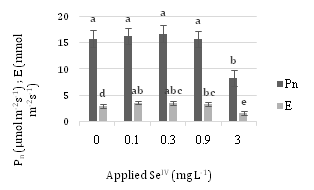
Figure 7 displays Pn and E values at different concentrations of SeVI. 0.3 mg L-1SeIV in Pn and 0.1 mg L-1SeIV in E has the most amount and diminish process in 0.9 and 3 mg L-1SeIV is obvious.
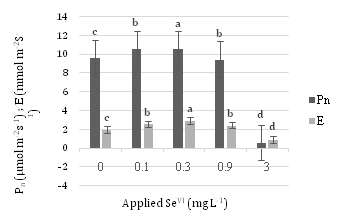
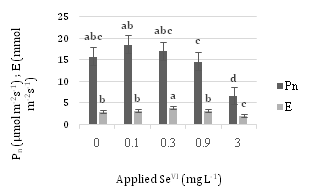
Figure 8 displays Pn and E values at different concentrations of SeVI. 0.1 mg L-1SeIV in Pn and 0.3 mg L-1SeIV in E has the most amount and diminish process in 0.9 and 3 mg L-1SeIV is obvious.
Concerning Fo, although there is no significant difference with increasing the application of different level of selenate, Fv and Fm had the opposite trend. Control samples in both Fv and Fm have the highest values comparing with the 0.9 and 3 mg L-1SeVI samples, which have lower and lowest values, respectively.
As the concentration of applied Se further increased from 0.9 to 3 mg L–1 SeVI, both the Fv/Fm and Fv/Fo ratios, Pn and E tended to decrease.
These current results indicate despite the reductions in the efficiency of the PSII photochemistry (Fv/Fm) in SeVI treatments, this ratio did not changed significantly in all SeIV treatments. These differences show that sunflower is able to better maintain its PSII activity even at the high level of SeIV.
Valkama et al.21 suggested that the high selenate dosage had a harmful effect on photosynthesis via changes in activity and/or biosynthesis of enzymes, rather than via alteration of PSII. In a field experiment, it is reported that, applied Se as selenite at concentrations ranged from 20 to 50 g Se ha-1 enhanced photosynthesis rate and the activity of the photosynthetic system in rice plants.22 Nevertheless, as the concentration of selenite increased > 50 g Se ha-1, both the Fv/Fm and Fv/Fo ratios tended to decrease. Some studies Focused on the enhanced effect of Se on different parameters of chlorophyll fluorescence under different stresses including UV-B radiation in strawberry,21 under cadmium stress in rape seedlings23 as well as under high temperature stress sorghum.24
Producing Se-enriched crops is viewed as nutritionally significant for Se-deficient regions of the world where diets were reported to have insufficient amounts of Se,25-28 due in part to inadequate Se in food crops.26,28 The presented results allow us to conclude that the effects of Se in amount of 0.1 and 0.3 mg L-1SeVI on sunflower plants that were grown in nutrient solution cultures provide the best results in almost all chlorophyll fluorescence (Fv/Fm and Fv/Fo) and photosynthetic (Pn and E) apparatus in both old and young leaves, then appropriate application of Se can protect the photosynthetic system from injury whereas further concentration of Se in both forms of SeIV and SeVI (> 0.3 mg L-1) has reverse above effects.
Finally, the activity of the photosynthetic system in sunflower is closely associated with the application of Se, and the appropriate Se content in the plants might prompt photosynthesis, causing to increased production and the photosynthesis or chlorophyll fluorescence parameters can be applied to determine the Se status for production of Se-rich sunflower.
None.
The author declares no conflict of interest.

© . This is an open access article distributed under the terms of the, which permits unrestricted use, distribution, and build upon your work non-commercially.